ENGINEERING
Urban flood design after stationary rainfall: models, maintenance, and green infrastructure
NOAA’s evolving rainfall atlas, EPA’s green-infrastructure agenda, and a September 2026 drainage-model preprint show why flood design needs changing inputs and field data.
Research checked
Newest cited publication
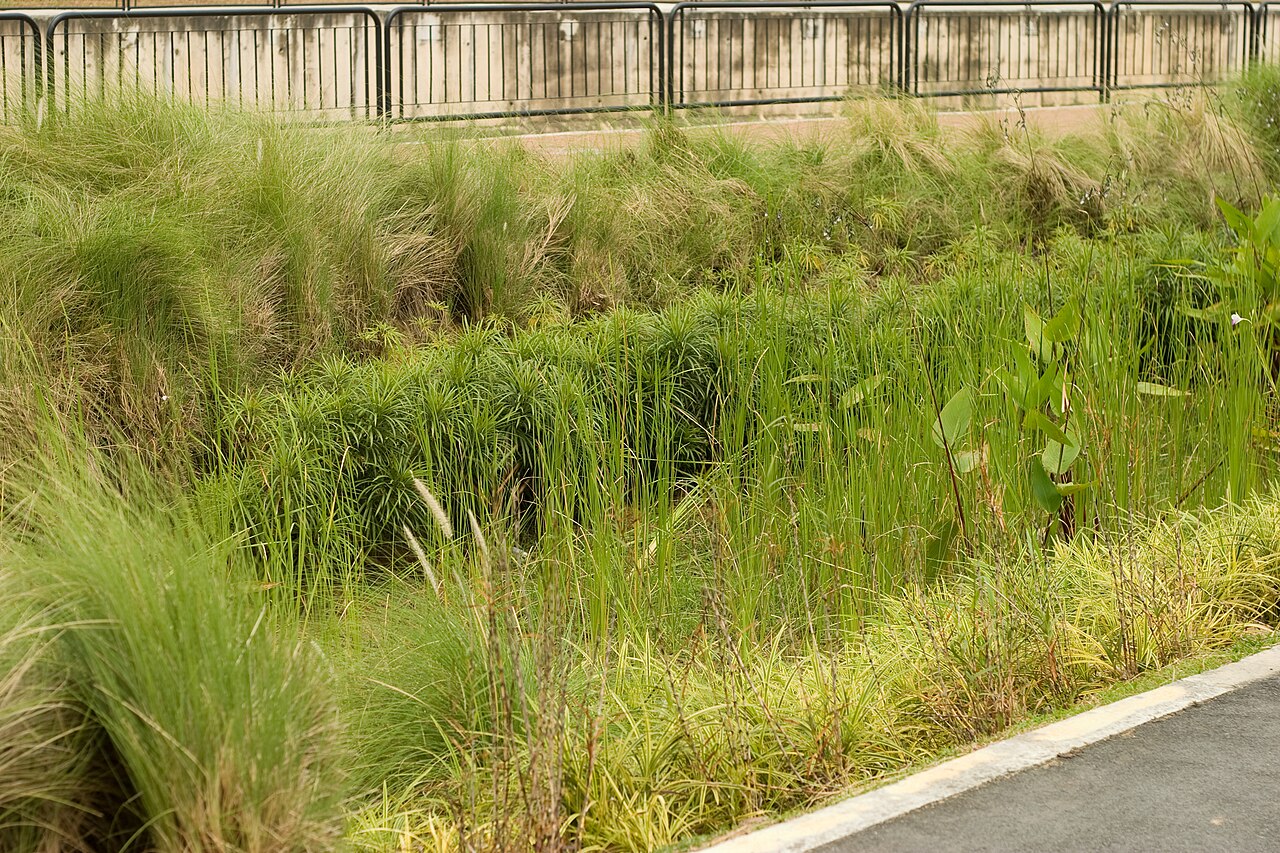
A rain garden in Singapore illustrates green stormwater infrastructure. Its protection against any particular flood requires the site-specific assessment described in the article.
Rogersoh / Wikimedia Commons · Image source · CC BY-SA 3.0

A drainage system is often designed with a rainfall number, but its performance depends on a chain of assumptions: where rain falls, how quickly runoff reaches an inlet, whether the inlet is clear, and where water goes when the pipe fills. Current work is changing several links in that chain. NOAA is developing a precipitation atlas that explicitly considers changing extremes over time. EPA’s September 2025 green-infrastructure agenda treats long-term delivery as an institutional as well as a hydraulic problem. A drainage-network preprint revised in September 2026 explores how a few sensors can help reconstruct flows. These developments are complementary. None permits an engineer to replace site knowledge with a single future rainfall multiplier or a model that has never met an actual storm.
The rainfall input is becoming time dependent
NOAA’s Atlas 15 information page describes a move from stationary precipitation-frequency estimates toward methods that account for temporal trends. Its planned first volume addresses present estimates using historical observations; a second addresses future conditions using climate-model information. The page distinguishes pilot and preliminary products from published estimates and continues to identify Atlas 14 as the current national standard. As of this article’s cutoff, the evidence supports a development program and its stated timetable, not an assumption that every planned product is already finalized.
Stationarity means treating the statistical distribution as unchanged over the period of interest. It does not mean every year has identical rainfall. Dropping that assumption means a quoted annual exceedance probability needs a time context. An event with a one-percent annual chance under one set of conditions may not retain that chance throughout an asset’s service life. This matters for a pipe expected to operate for decades, but it also creates a communication task: planners need to distinguish a projection, a selected design scenario, and an observed event.
A return period is not an appointment
A so-called hundred-year event is commonly shorthand for a one-percent annual exceedance probability under a specified model. It does not imply a century-long waiting period after the last occurrence. For an illustrative stationary calculation with independent years, the chance of at least one exceedance in thirty years is one minus 0.99 raised to the thirtieth power, approximately twenty-six percent. If the probability changes over time, the corresponding calculation uses the sequence of yearly non-exceedance probabilities instead.
The independence assumption in that example is a teaching device, not a complete climate model. Its value is showing why the service horizon matters. A homeowner, a transport authority, and a hospital operator may care about different consequences even when they use the same rainfall dataset. A drainage design should therefore state what failure means: water remaining in a street, an emergency route becoming impassable, or a building flooding. The acceptable frequency cannot be assessed intelligently without the consequence and the time horizon.
Follow runoff, storage, and conveyance separately
EPA’s Storm Water Management Model, usually called SWMM, represents runoff and its routing through drainage networks. Its documented capabilities include storage, pumps, surcharging, backwater, and green-infrastructure controls. This makes it useful for examining combinations of pipes and distributed measures rather than treating them as competing slogans. EPA also notes that maintenance of the older SWMM Climate Adjustment Tool ended on March 18, 2025, directing users toward the developing NOAA Atlas 15 effort. That is a change in supporting tools, not the retirement of SWMM itself.
A useful first check is conservation of water. In an invented one-hectare catchment, twenty millimeters of rainfall corresponds to two hundred cubic meters of water before accounting for losses or inflows from elsewhere. A model should explain how that volume is divided among infiltration, temporary storage, evaporation, and discharge. Peak flow then depends on timing. Two designs can discharge the same event volume while producing very different maximum flows. Reporting both quantities prevents a successful retention result from being mistaken for a complete flood-control result.
Distributed storage needs an overflow story
EPA’s September 2025 strategic agenda frames green infrastructure around durable outcomes, regulatory applications, broader benefits, and funding or technical assistance. Its emphasis is useful because a rain garden is simultaneously a hydraulic component, a maintained landscape, and an asset with an owner. The agenda is a policy and implementation roadmap. It does not supply a universal percentage reduction that can be copied into every urban flood design.
A planted depression can temporarily store runoff and encourage infiltration, while a pipe conveys water away. They can support each other. However, a saturated soil layer, clogged inlet, high groundwater level, or storm that exceeds storage changes the outcome. A robust concept shows where excess water goes after the green component fills. That overflow route may be a street, channel, or conventional drain. Designing the exceedance condition explicitly is more useful than drawing only the system’s preferred operating state on a sunny-day plan.
A few sensors can inform a larger network model
The September 25, 2026 revision of Zihang Ding and colleagues’ preprint, Flow Reconstruction from Sparse Measurements in Urban Drainage Networks, evaluates a data-driven sparse-sensing workflow on a modeled 77-node network. It uses SWMM-generated flow patterns to select monitoring locations and reconstruct conditions at unmonitored nodes. The evaluation includes held-out simulations, parameter variation, measurement noise, and individual sensor failures. This is a model-based assessment rather than proof that three instruments can reliably describe every real city sewer.
The mathematical idea is that many node flows may vary in a coordinated way, so a lower-dimensional set of patterns can describe much of the network behavior. Measurements at carefully selected locations help estimate the weights of those patterns. This can be efficient when new conditions resemble the relationships used to construct the basis. It can fail when an unmodeled blockage, an unfamiliar storm pattern, or changed infrastructure creates behavior outside that basis. The most informative field test would deliberately include such departures rather than only familiar operating conditions.
The asset can change while the drawing stays still
The same catchment can behave differently after vegetation grows, sediment accumulates, a street is resurfaced, or an informal connection is added. Treating maintenance as an optional paragraph after the hydraulic calculation misses this feedback. A model’s inlet capacity and infiltration parameters describe a state of the assets, not a permanent property guaranteed by construction. Inspection records can therefore be engineering data, particularly when they explain a difference between predicted and observed runoff.
EPA’s modeling toolkit includes tools that evaluate costs, runoff, pollutant loads, and combinations of green and gray infrastructure. These support different planning questions; they should not be treated as interchangeable predictions. A long-term annual retention calculator, for example, does not automatically resolve minute-by-minute street flooding during a short intense storm. The right tool is the one whose temporal and spatial resolution matches the decision, and whose input assumptions can be checked against the available observations.
Make the next revision easier
My engineering conclusion is to treat urban drainage as a monitored system with an explicit revision process. Preserve the rainfall dataset version, design horizon, asset condition, and model parameters used for each decision. Keep calibration storms separate from independent checks. When observations disagree with predictions, investigate rainfall measurement, inlet condition, model structure, and network changes before assuming that one parameter can absorb every error. That record makes later adaptation possible without reconstructing the whole argument from an old drawing.
The current developments point toward the same discipline from different directions. Atlas 15 asks engineers to express time dependence in rainfall statistics. The EPA agenda asks who will sustain distributed infrastructure and its benefits. Sparse sensing asks how limited measurements can improve network awareness. A convincing flood design joins these questions while preserving their uncertainties. The result is not a promise that streets never flood. It is a documented system with understood failure paths, maintained assets, and a practical way to improve the design as new evidence arrives.
Sources & further reading
Primary papers, project documentation, and research releases used in this article. Publication dates below refer to the sources themselves.
- Welcome to the NOAA Atlas 15 Informational PageNational Oceanic and Atmospheric AdministrationChecked
- EPA’s 2035 Green Infrastructure Strategic Agenda: Restoring nature and greening urban spacesU.S. Environmental Protection AgencyChecked
- Storm Water Management Model (SWMM)U.S. Environmental Protection AgencyChecked
- Green Infrastructure Modeling ToolkitU.S. Environmental Protection AgencyChecked
- Flow Reconstruction from Sparse Measurements in Urban Drainage Networks: An Application and Evaluation of Data-Driven Sparse SensingarXivPublished Checked
FOLLOW THE QUESTION
Explore engineering