PHYSICS
SPHEREx’s Full-Sky Spectrum Turns a Picture Into a Measurement
SPHEREx’s first full-sky survey and 2026 data releases show how infrared spectra separate cosmic chemistry, galaxy distances, and foreground light.
Research checked
Newest cited publication
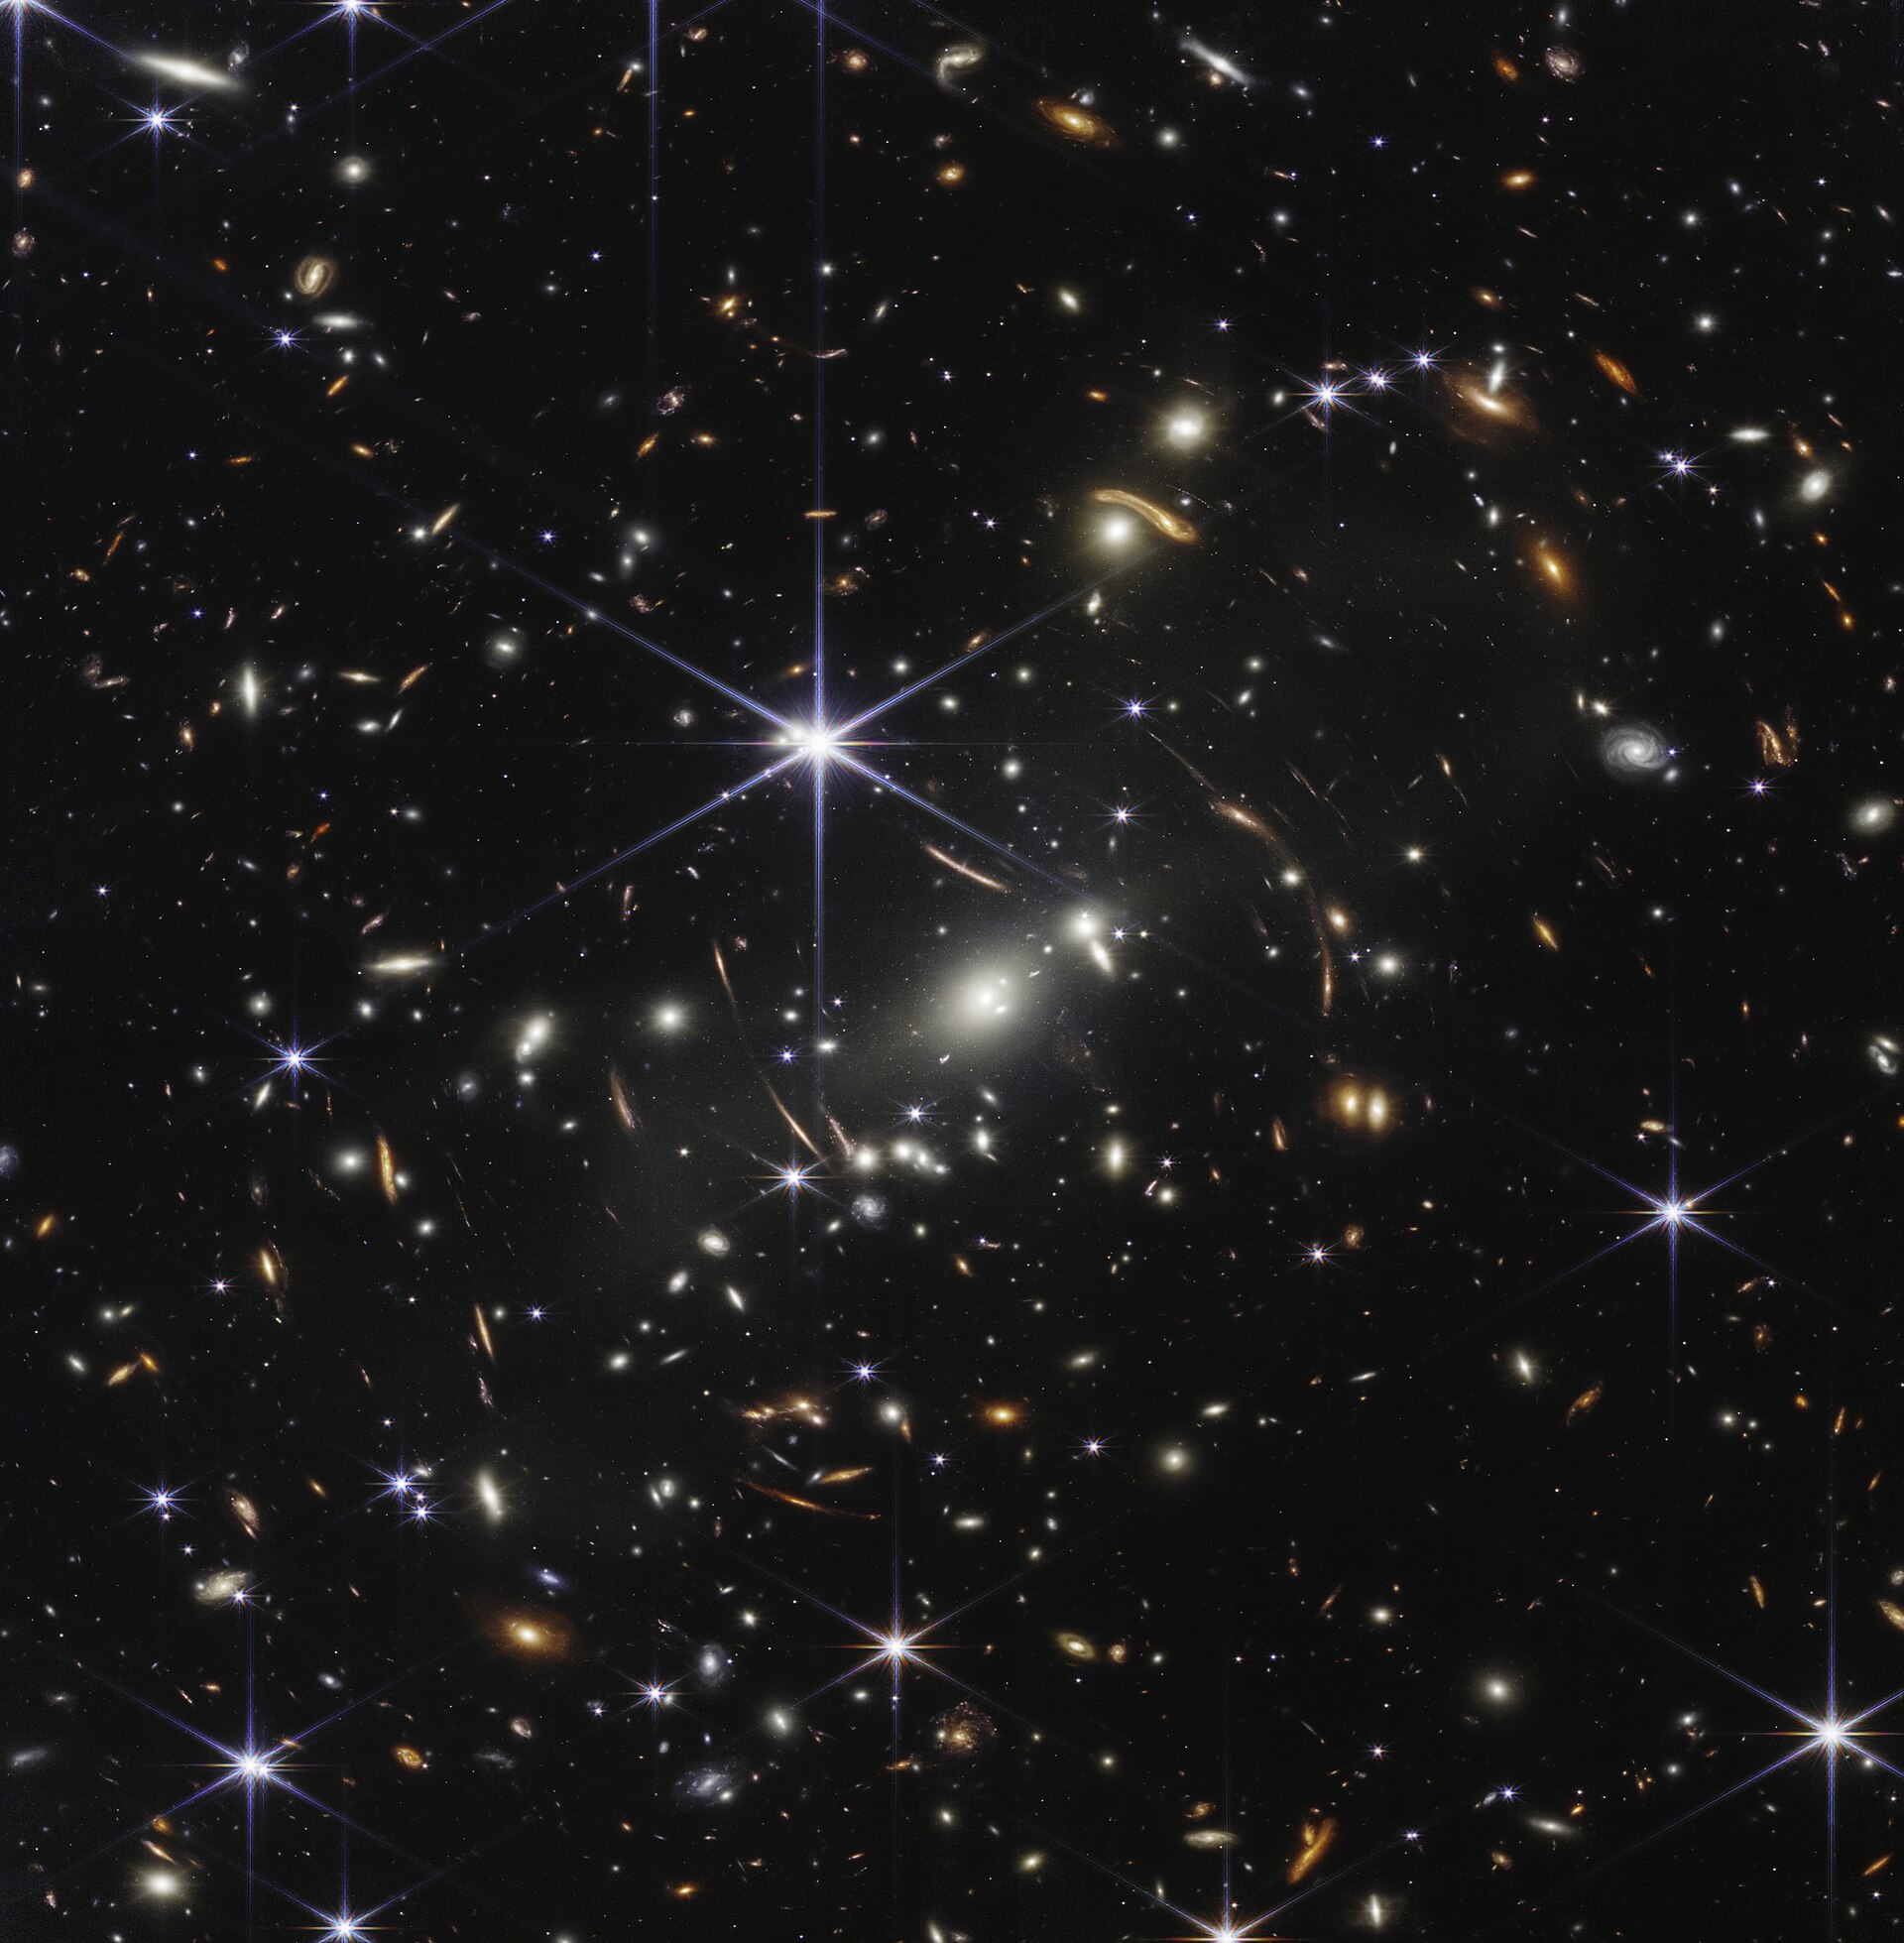
A deep-field image provides an astronomical reference point for the distinction between a picture and a spectrum; SPHEREx conducts the all-sky spectral survey discussed here.
NASA, ESA, CSA, and STScI · Image source · Public domain

A photograph records where light arrives. A spectrum adds clues about what emitted or absorbed it, and how that material is moving relative to us. NASA announced completion of SPHEREx's first all-sky infrared map on December 18, 2025. By September 2026, the public archive was releasing its third quick-release processing generation, and researchers were publishing new spectral maps derived from earlier products. This progression matters: collecting the sky, calibrating a public dataset, and demonstrating a physical inference are different achievements. SPHEREx's promise comes from connecting them carefully. Its broad coverage becomes scientifically powerful when the meaning and uncertainty of each wavelength measurement remain available for analysis.
The instrument samples wavelength as well as position
The mission paper describes measurements in 102 spectral bands from 0.75 to 5 micrometers. Much of that light lies beyond human vision. A public color image therefore assigns visible colors to selected infrared information rather than reproducing what an astronaut's eyes would see. That does not make the picture less scientific. It means the color key is part of the measurement description. A red structure in one presentation may represent a wavelength or a spectral component rather than a physically red object.
SPHEREx uses a surveying strategy in which repeated views place a source at different positions behind wavelength-selective filters. Combining those measurements builds a low-resolution spectrum. The relevant trade-off is not simply sharpness against blurriness. A survey can sacrifice the angular or spectral detail of a targeted observatory to measure a vastly larger and more uniform population. These instruments answer complementary questions: detailed follow-up can examine unusual objects, while the survey tells researchers how common those objects are across the sky.
A spectral feature can carry both chemistry and distance
Suppose a recognizable feature has a rest wavelength of 1 micrometer and appears at 1.5 micrometers. The redshift is the observed wavelength divided by the rest wavelength, minus one: in this invented example, 0.5. That calculation does not identify a feature by itself. Another physical feature can occur at a different rest wavelength and produce a similar observation. Using several bands and a model of the overall spectral shape helps resolve the ambiguity. Distance inference therefore relies on interpretation, not only wavelength arithmetic.
Resolution also matters. Resolving power is wavelength divided by the smallest characteristic wavelength separation the instrument can distinguish. A hypothetical resolving power of 100 at 3 micrometers corresponds to about 0.03 micrometers. A finer structure could be blended even when the broad feature is recognizable. These independently worked examples illustrate why a low-resolution all-sky survey is useful without pretending it measures every spectral line sharply. A reported redshift or abundance should include the limitations of the available information.
Coverage is a milestone, not an inflation result
NASA's December 2025 announcement established that SPHEREx had completed its first map of the entire sky in its 102 infrared colors. The mission's intended cosmology includes studying galaxy distributions for information about the early universe. Completing a pass across the sky does not itself measure the mechanism of inflation. That inference needs calibrated source measurements, selection functions, redshift estimates, foreground control, and a statistical comparison between cosmological models. A mission can make excellent operational progress while its headline theoretical questions remain open.
There is an instructive analogy with a national census. Visiting every district is important, but estimating population trends also requires consistent definitions, duplicate removal, and knowledge of missed respondents. An astronomical survey faces corresponding problems when sources overlap, detection sensitivity changes, or foreground emission varies across the sky. Uniform coverage provides the framework for controlling those effects. Its value is not merely the number of objects in a catalog, but the possibility of understanding how inclusion in that catalog depended on the underlying sky.
Separating molecular bands from a broad infrared glow
A preprint submitted on September 29, 2026, presents full-sky maps of emission around 3.3 micrometers and the adjacent 3.4–3.5 micrometer complex, using SPHEREx QR2 data. These features are associated with polycyclic aromatic hydrocarbons and related carbonaceous material. Unlike a broadband image in which a feature is inferred as an excess, spectral sampling lets the authors fit a continuum and the bands more directly. The paper is a submitted preprint at the research cutoff, rather than a result described here as already peer reviewed.
The distinction between a combined band measurement and its decomposition is especially useful. The authors identify combined radiance as the primary product and release the separated components with modeling uncertainty. A fitting model can divide overlapping light into physically meaningful categories, but the categories may be less secure than their total. An independent analogy is separating two nearly overlapping musical notes in a recording: the total energy can be well constrained even when the exact contribution assigned to each note depends on the chosen model.
Emission depends on excitation as well as material
The spectral-map authors emphasize that these molecular emission bands trace both small carbonaceous grains and the radiation field that excites them. That qualification prevents a common mistake: interpreting brightness as a direct inventory. Two regions with the same amount of material can emit differently if they receive different illumination. Conversely, equal brightness can arise from different combinations of abundance and excitation. Spectroscopy supplies additional discriminating information, but it does not remove the need for a physical model.
For a worked conceptual comparison, imagine two identical fluorescent signs, one illuminated with twice as much ultraviolet power. The brighter sign need not contain more fluorescent material. Inferring abundance requires either controlling or estimating the illumination. Interstellar spectroscopy has a more complicated version of that logic, involving grain properties, radiation, geometry, and absorption along the line of sight. The interpretation becomes stronger when other wavelengths constrain those nuisance quantities instead of leaving brightness to stand in for all of them.
Galactic ice is measured through missing light
On April 15, 2026, JPL reported SPHEREx observations of extensive ice-bearing regions in molecular clouds, including water, carbon dioxide, and carbon monoxide ice associated with dust. The physical contrast with an emission map is important. An absorption feature measures how material changes light passing through or emerging from a region. A bright infrared structure and a deep absorption feature can therefore reveal different aspects of the same cloud. Neither should be treated as an uncomplicated three-dimensional photograph of all material present.
One original thought experiment shows the geometrical issue. Put the same absorbing slab in front of a bright lamp and then behind it. The slab's composition is unchanged, but its absorption signature in the observed lamp light can disappear in the second arrangement. Astronomers must account for the locations of sources and absorbers when interpreting cloud spectra. Wide-area coverage helps reveal where features recur; targeted observations and models are then needed to relate them to cloud structure and the environments where stars form.
A released pixel needs provenance and an uncertainty
The archive's September 28, 2026 documentation records the introduction of QR3 that month and distinguishes calibrated images, flags, variance information, foreground models, and instrument-response products. Those supporting arrays matter as much as the attractive mosaic for quantitative work. A flagged detector pixel should not quietly count as ordinary evidence. A foreground model must not be confused with a direct observation of the background universe. Processing versions also need to remain visible when results from different releases are compared.
My assessment is that the defining opportunity is the reuse of one spectral survey for questions with different failure modes: galaxy redshifts, diffuse emission, and ice absorption. Their common instrument does not make their uncertainties identical. A good analysis states which processing generation it used, how it handled blended sources and foregrounds, and what assumptions connect the fitted spectrum to the final physical quantity. SPHEREx's first full-sky pass supplies the raw breadth. The 2026 analyses and releases begin to show how that breadth becomes an accountable measurement.
Sources & further reading
Primary papers, project documentation, and research releases used in this article. Publication dates below refer to the sources themselves.
- The SPHEREx Satellite MissionSPHEREx Collaboration / arXivPublished Checked
- NASA’s SPHEREx Observatory Completes First Cosmic Map Like No OtherNASA Jet Propulsion LaboratoryPublished Checked
- A Full-Sky SPHEREx Map of Integrated 3.3 and 3.4 μm PAH EmissionRoke Cepeda-Arroita and collaborators / arXivPublished Checked
- ‘Interstellar Glaciers’: NASA’s SPHEREx Maps Vast Galactic Ice RegionsNASA Jet Propulsion LaboratoryPublished Checked
- SPHEREx Data ProductsCaltech/IPAC-IRSAPublished Checked
FOLLOW THE QUESTION
Explore physics