PHYSICS
MoM-z14 and the physics behind an early-galaxy distance record
MoM-z14’s January 2026 publication connects a confirmed redshift with early star formation, uncertain chemistry, and the statistics of rare galaxies.
Research checked
Newest cited publication
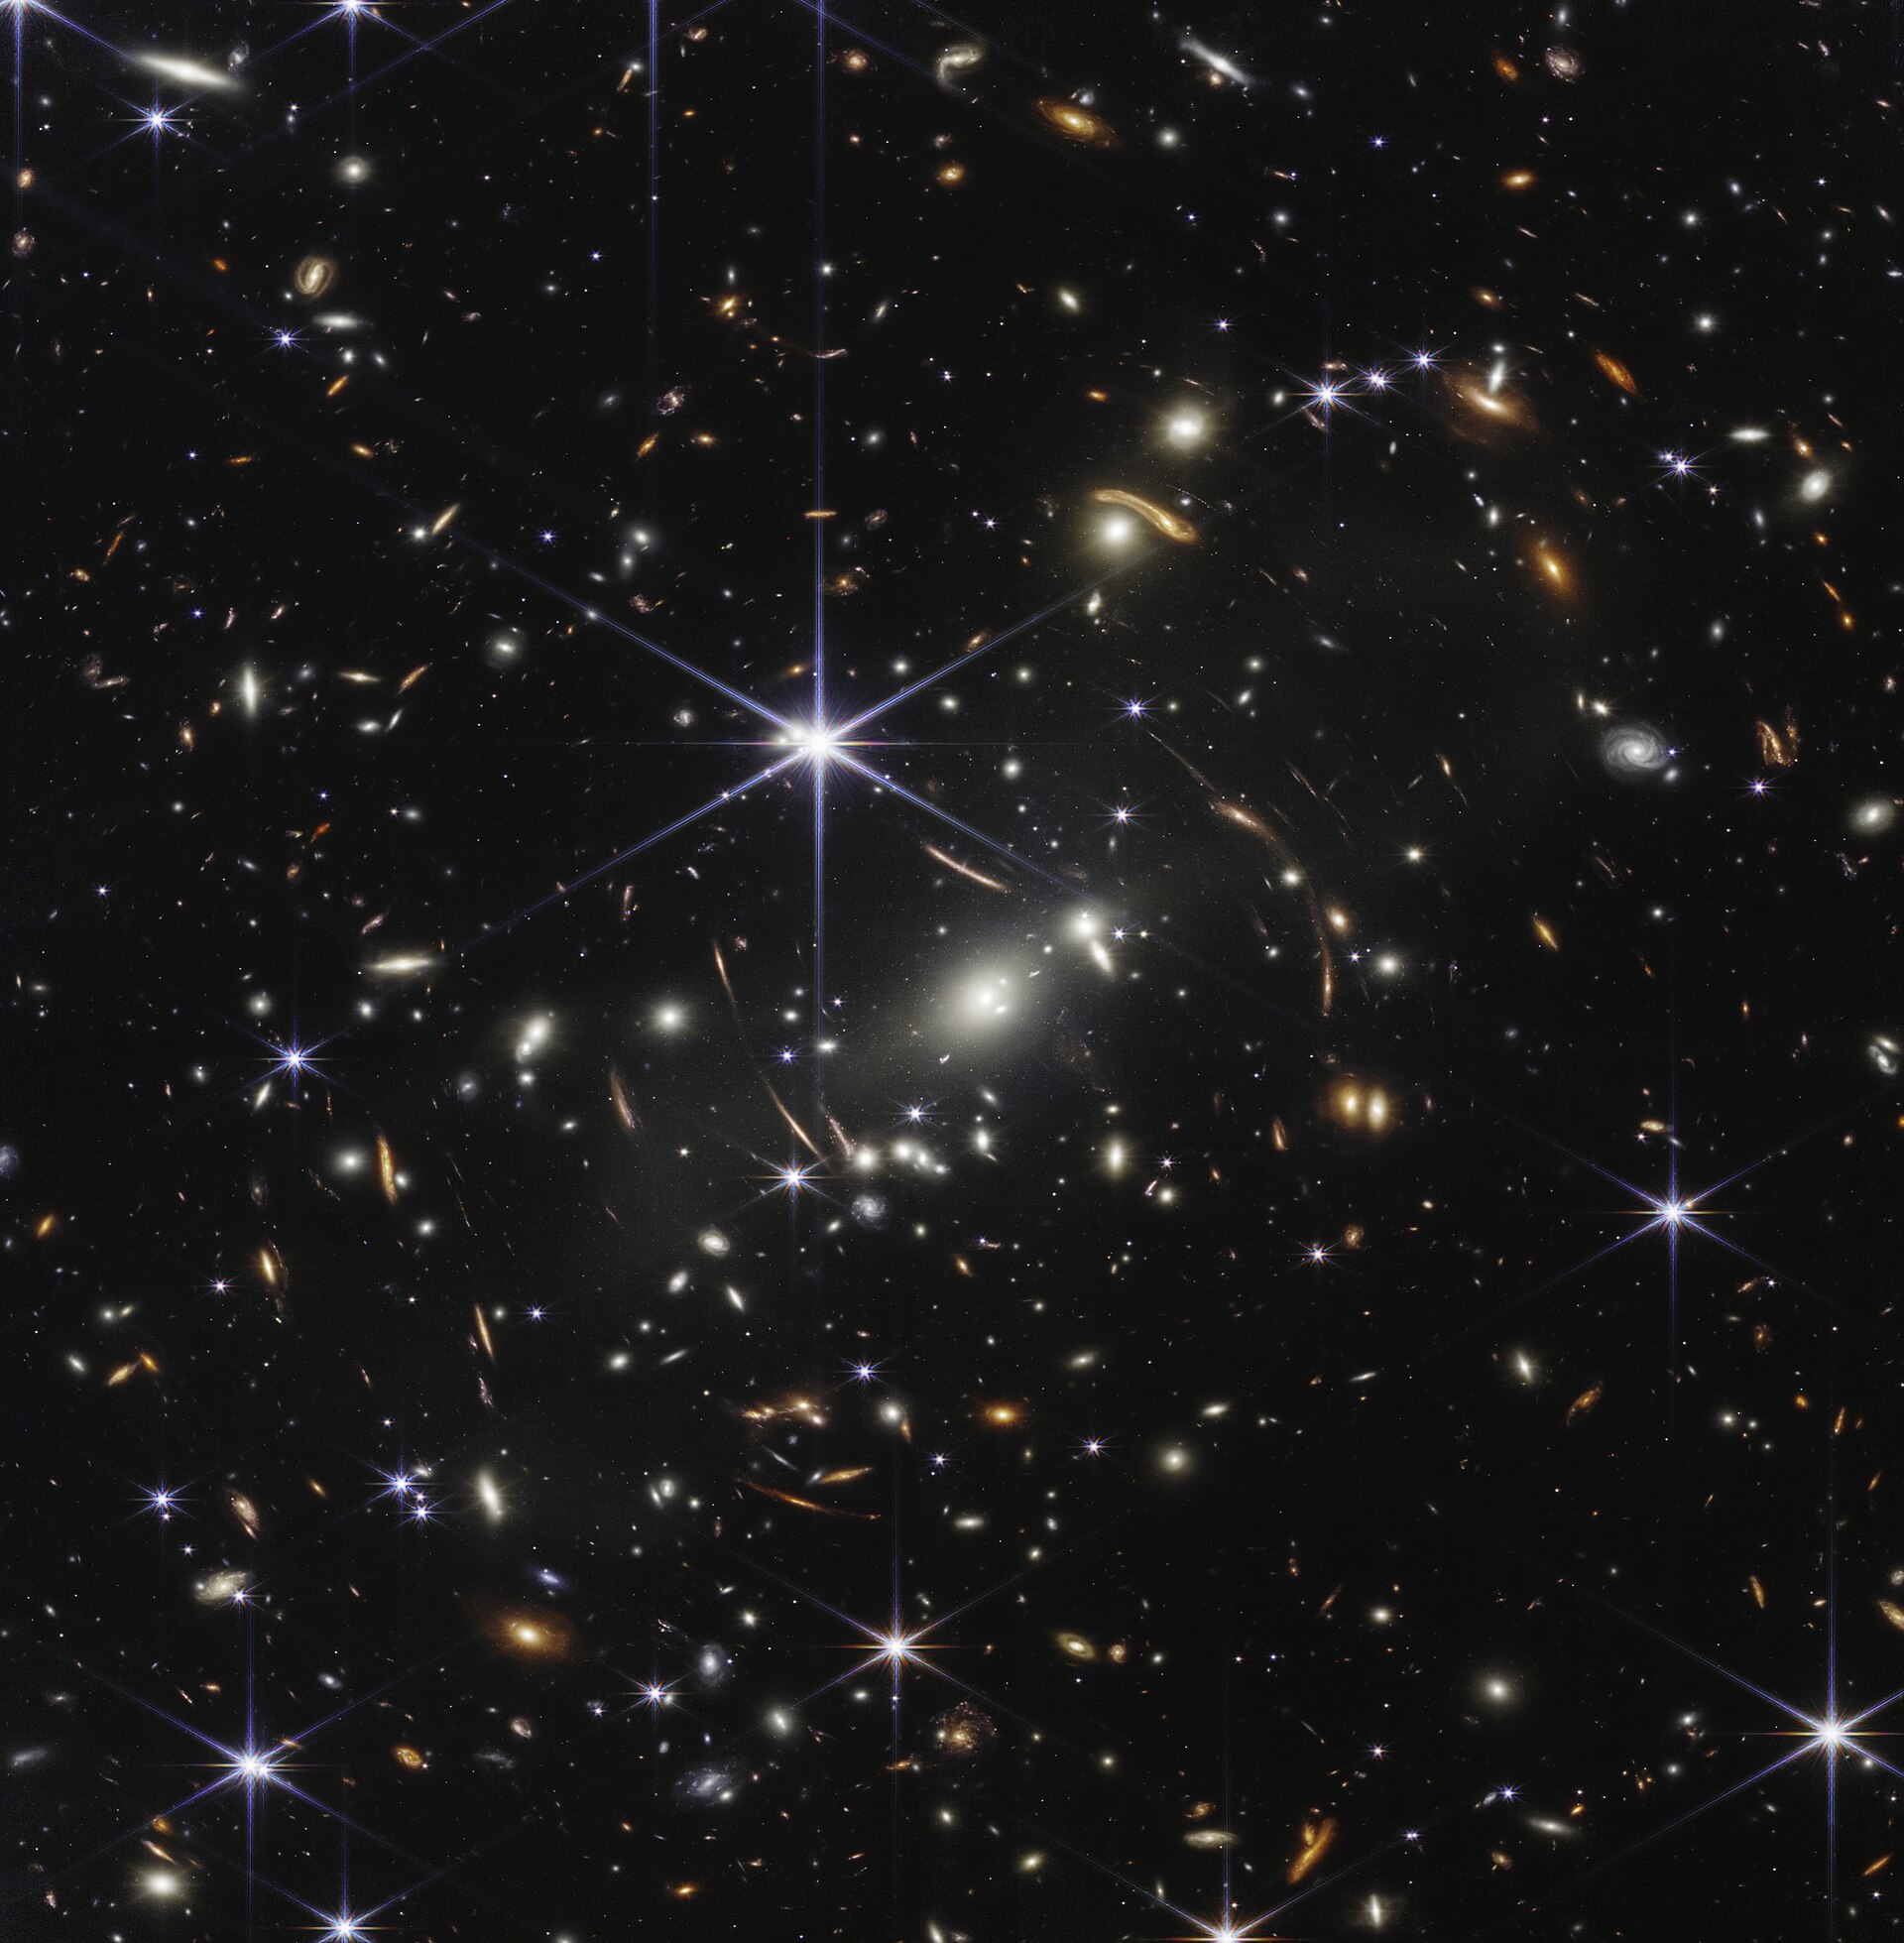
Webb’s deep-field view illustrates the dense background of distant galaxies. The MoM-z14 redshift measurement concerns the separately identified target discussed in the article.
NASA, ESA, CSA, and STScI · Image source · Public domain

A distant-galaxy record is a measurement before it is a milestone. MoM-z14, described in a paper published on January 30, 2026, has a spectroscopically confirmed redshift of about 14.44. In the cosmological model used to interpret that measurement, its light was emitted roughly 280 million years after the big bang. The observation reaches an extraordinarily early period, but the distance record is only the beginning. Its brightness, compactness, and spectrum raise questions about how quickly galaxies built stars and altered their surroundings. The scientific challenge is to separate secure spectral evidence from the more model-dependent history inferred from it.
Measure the stretch before calculating the age
Cosmological redshift describes how expansion stretches a wavelength between emission and observation. The relation is straightforward: observed wavelength equals emitted wavelength multiplied by one plus redshift. At a redshift of 14.44, that factor is 15.44. As an illustrative calculation, a feature emitted at 0.15 micrometers would arrive near 2.32 micrometers. Ultraviolet light from an early galaxy can therefore land in Webb’s infrared observing range.
The age assigned to the observation requires another step. Researchers insert the redshift into a cosmological model that specifies the expansion history. That produces an estimated time since the big bang when the light was emitted. Redshift itself is the spectral measurement; the age is a derived quantity. Neither number says that the galaxy is currently only a few hundred million years old. We are observing an earlier state because light takes time to reach us.
Distance language can become especially confusing in an expanding universe. Light-travel time, present-day separation, and the distance used to relate luminosity to flux are different quantities. Multiplying a lookback time by the speed of light does not automatically give every useful definition of distance. For this result, quoting the measured redshift and the inferred emission epoch communicates the observation more cleanly than treating a single enormous distance as a universal ruler.
Why spectroscopy changes a candidate into a measurement
An image taken through several filters can identify a promising high-redshift candidate. If the source disappears from shorter-wavelength bands but appears in longer ones, a spectral break may have shifted through those filters. However, broad-band colors can sometimes be mimicked by other combinations of dust, emission lines, and lower redshift. Spectroscopy spreads the light into many wavelength channels and tests a more specific explanation.
For MoM-z14, the discovery paper reports a sharp Lyman-alpha break together with approximately three-sigma detections of five ultraviolet emission lines. A joint pattern is more informative than one isolated bump: a proposed redshift should place several features in mutually consistent positions. The fitted redshift is 14.44 with a reported uncertainty of about 0.02. Individual weak lines still require careful interpretation, even when the combined distance determination is compelling.
Webb’s Near-Infrared Spectrograph, or NIRSpec, supplied the spectroscopy after identification in Near-Infrared Camera imaging. These are complementary tasks. Imaging efficiently finds targets over an area; spectroscopy spends photons distinguishing wavelengths. The instrument’s official documentation describes several observing modes rather than one universal spectrum-taking method. For any record claim, knowing the actual mode, resolution, sensitivity, and reduction procedure helps establish which features were measured and which were inferred from the fit.
A bright young population is not automatically a huge mass
NASA’s January 28 announcement emphasizes that Webb has been finding galaxies that are brighter and more chemically developed than expected at early times. Brightness is an important clue, but it is not interchangeable with stellar mass. A small population containing many hot young stars can emit ultraviolet light efficiently. An older population with the same total mass can look quite different in that band.
An illustrative comparison makes the inference problem clear. Suppose population A emits ten units of ultraviolet luminosity per unit mass while population B emits one. A source with one hundred luminosity units could contain ten mass units of A or one hundred mass units of B. Additional colors, spectral features, and a history model are needed to distinguish them. Real populations contain mixtures, and dust introduces another factor.
The MoM-z14 paper interprets its spectrum as evidence for rapidly increasing recent star formation and describes an extremely compact, elongated source. Those conclusions combine measured light with stellar-population and structural modeling. They are scientifically meaningful without becoming direct images of individual newborn stars. My inference is that the best tests of the interpretation will combine independent indicators sensitive to different stellar ages, while checking whether an accreting black hole could contribute some of the observed radiation.
Chemical clues with several possible histories
The published analysis highlights unusual nitrogen-related emission and tentative evidence that the immediate environment may be partly ionized. These observations motivate ideas about dense stellar populations and early enrichment, but the strength of an emission line does not depend on elemental abundance alone. Gas density, temperature, radiation spectrum, and ionization state all affect how efficiently particular transitions emit.
One can see the ambiguity without detailed atomic calculations. A brighter line might indicate more atoms of the element, more frequent excitation of the same atoms, or a larger fraction residing in the ionization state that produces the line. If several of these factors change together, interpreting a line ratio requires a coupled model. Measuring more transitions can help because different transitions respond differently to those conditions.
Ionization adds another layer. Photons can remove electrons from hydrogen and modify the absorption seen around a distant galaxy. A locally ionized region need not mean that the entire universe at that epoch was already ionized. Nearby sources and the galaxy’s own emission can create an unusual local environment. Conversely, an apparently weak absorption signature can reflect uncertainties in intrinsic spectrum or gas geometry. The authors label the environmental evidence tentative, and that qualification should survive every retelling.
A record galaxy tests population statistics
ESA’s image documentation explains why the target remains useful even after another galaxy takes the distance record: its physical properties constrain the early universe. The published paper also compares the abundance of bright early sources with pre-Webb expectations. Such a comparison is more demanding than counting dots. It requires knowing survey area, sensitivity, selection criteria, and the fraction of real sources that the search would miss.
Consider a deliberately simplified survey. If its detection process recovers only half of qualifying galaxies, finding ten candidates does not imply that only ten exist in the sampled region. Correcting for recovery efficiency might suggest twenty, before contamination and uncertainty are considered. If galaxies cluster spatially, observing one patch of sky can also give an unusually high or low count. Rare-object statistics therefore require uncertainties that reflect both small samples and selection.
The exciting outcome is a sharper set of questions rather than a declaration that cosmology has failed. Are early star-formation episodes brighter or more variable than assumed? Does dust attenuation differ? Are some luminous sources powered partly by black holes? More spectroscopy and independent survey fields can discriminate among these explanations. Through the October 18, 2026 research cutoff, MoM-z14 offers a particularly clear example of the process: establish the spectrum, calculate its cosmological placement, infer a physical population, and then test that inference against additional observations.
Sources & further reading
Primary papers, project documentation, and research releases used in this article. Publication dates below refer to the sources themselves.
- A Cosmic Miracle: A Remarkably Luminous Galaxy at z_spec = 14.44 Confirmed with JWSTThe Open Journal of AstrophysicsPublished Checked
- NASA Webb Pushes Boundaries of Observable Universe Closer to Big BangNASAPublished Checked
- COSMOS Field MoM-z14 Galaxy (NIRCam pullout image)ESA/WebbPublished Checked
- NIRSpecNASAChecked
FOLLOW THE QUESTION
Explore physics