PHYSICS
PUNCH’s First Storm Forecast: What a Thirty-Minute Arrival Error Means
NASA’s August 2026 PUNCH test tracked one solar eruption to a half-hour arrival error, opening a careful test of imaging, geometry, and forecast uncertainty.
Research checked
Newest cited publication
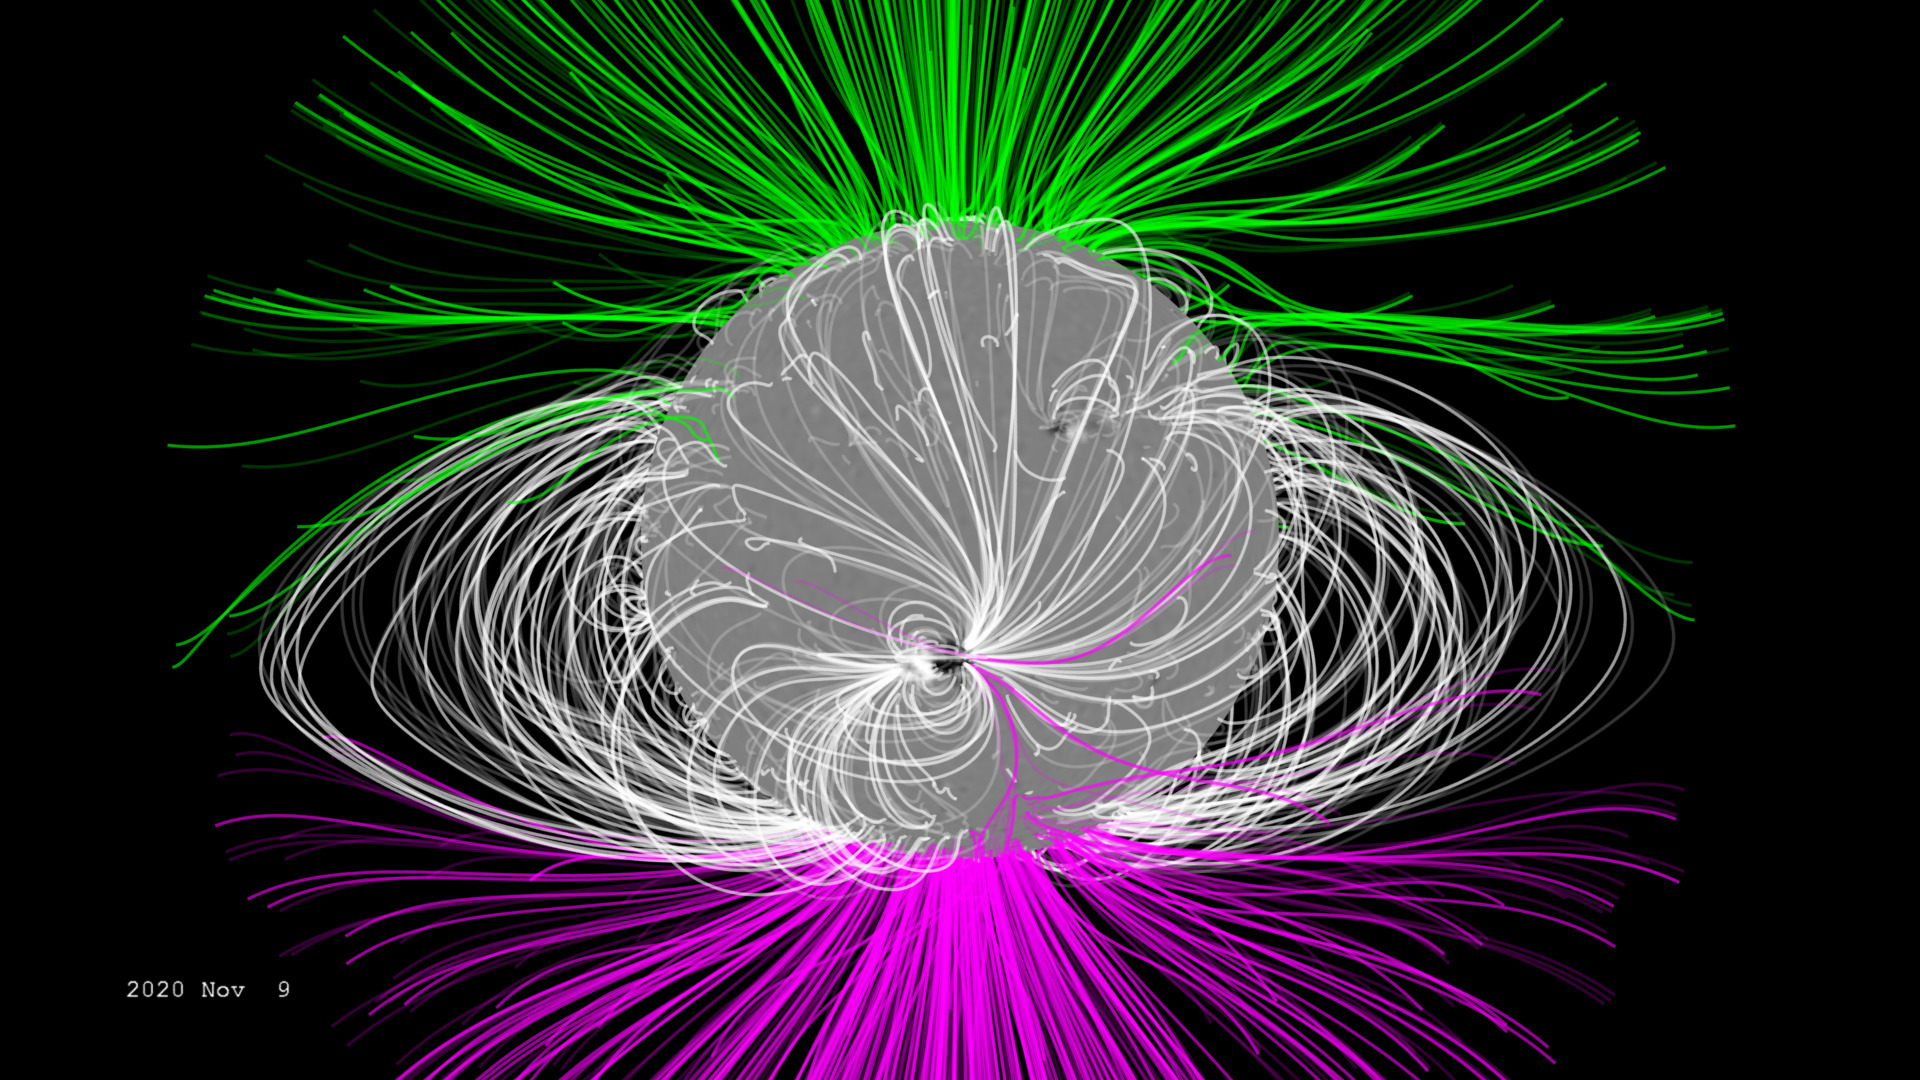
A NASA solar magnetic visualization introduces the source environment of solar storms; the PUNCH forecast comparison uses the observations and timing criteria described in the article.
NASA’s Scientific Visualization Studio: Tom Bridgman (Global Science and Technology, Inc.); Joy Ng (eMITS); Laurence Schuler and Ian Jones (ADNET Systems, Inc.) · Image source · Public domain
A solar eruption can be visible near the Sun and still become difficult to follow on its journey toward Earth. NASA’s PUNCH mission addresses that missing middle. On August 4, 2026, NASA described an initial retrospective forecast test using a coronal mass ejection that left the Sun on May 31, 2025. The predicted near-Earth arrival missed by less than thirty minutes. That is an exciting individual result. Understanding its value requires separating the observed event, the information available at each forecast time, and the statistical performance that a forecasting service would need to demonstrate across many storms.
The published account describes one retrospective test
PUNCH stands for Polarimeter to Unify the Corona and Heliosphere. NASA’s August report says that researchers followed the eruption’s leading edge using continuous imagery and a model incorporating speed and geometry. Twelve hours after departure, the estimate stabilized on an arrival eight hours later. The final error was within half an hour. At the time of that announcement, the result had been presented at the Committee on Space Research meeting and was under review at the journal Space Weather.
Those details define the evidence boundary. The demonstration is retrospective: researchers already had a completed event to analyze. That does not make it uninformative, but it creates questions about data selection, parameter choices, and whether the same procedure could have been run using only information delivered in real time. The reported half hour is an error for this event, not a confidence interval covering all future events. A reproducible forecast experiment should preserve every intermediate estimate, including the unstable early ones, and explain when a human forecaster would have been told to act.
Four spacecraft form one connected measurement
The mission’s technical description explains a constellation with one Narrow Field Imager and three Wide Field Imagers. Their overlapping fields of view combine observations of the outer corona and young solar wind. The January 21, 2026 arXiv version is an accepted manuscript associated with a Solar Physics article published January 27. It documents what the observing system is designed to measure. NASA’s March 12, 2025 launch account establishes the start of the mission, separately from the subsequent analysis.
Four cameras do not automatically provide four widely separated views of a distant eruption. PUNCH’s spacecraft operate in low Earth orbit and function as a coordinated observing system. Their three-dimensional information also comes from polarization, not simply a human-like stereoscopic baseline. This distinction matters when interpreting a reconstruction. A colorful three-dimensional display represents a solution to an inference problem, with calibration and scattering assumptions, rather than a photograph whose depth is directly visible to an unaided eye.
How scattered sunlight carries depth information
NASA’s February 21, 2025 mission explanation describes sunlight scattered by material in the corona and solar wind. Polarization measurements help constrain where that material lies. In simplified terms, scattering depends on the angle between incident sunlight, the scatterer, and the observer. Measuring different polarization components provides information that ordinary total brightness discards. PUNCH combines that information with broad coverage and repeated observations to follow structures through space.
An independent analogy is locating a moving object from its shadow and reflected brightness rather than its outline alone. Several placements may produce similar outlines, but fewer produce the same outline, brightness, and polarization history together. The real inversion is harder because each image pixel adds light from material along a line of sight. Multiple structures can overlap. Consequently, a reconstructed leading edge should carry uncertainty arising from brightness calibration, background removal, and the possibility that the brightest feature is not always the same physical part of the eruption.
Why later observations can sharply improve timing
An elementary calculation shows why following an eruption farther matters. Suppose, purely for illustration, that a front has twenty million kilometers left to travel at a constant one thousand kilometers per second. Its remaining travel time is twenty thousand seconds, or about 5.56 hours. Holding distance fixed, reducing the assumed speed to nine hundred kilometers per second changes that to about 6.17 hours; increasing it to eleven hundred changes it to about 5.05 hours. A ten-percent speed error can therefore create roughly a half-hour timing error even quite late in the journey.
This toy calculation assumes straight motion, constant speed, and a correctly identified front. Real ejections expand, interact with the background wind, and can encounter other structures. Repeated measurements constrain those changes instead of forcing a forecast to extrapolate from a brief near-Sun view. They also reveal a practical tradeoff: a late forecast may be precise but offer little preparation time. Forecast quality should therefore be plotted against warning time. One final number cannot show whether an algorithm supplied useful guidance ten hours earlier.
The arrival clock is only one part of a storm
A coronal mass ejection carries both plasma and magnetic field. NOAA’s Space Weather Prediction Center explains that geomagnetic effects depend strongly on the field’s strength and direction, with a prolonged southward orientation favoring stronger disturbances. An arrival-time forecast does not by itself determine that orientation. Nor does locating the leading edge necessarily identify when the most geoeffective magnetic structure will pass Earth. A shock, sheath, and magnetic cloud can contribute different signatures.
Imagine two parcels delivered at exactly the predicted time. Knowing the delivery time does not tell you their contents. Likewise, excellent timing can coexist with uncertain intensity. This is not a reason to dismiss timing: operators can benefit from knowing when conditions are likely to change. It is a reason to attach the improvement to the correct task. A complete forecast system should separately evaluate Earth-impact probability, arrival time, duration, magnetic configuration, and resulting geomagnetic response, with evidence that each output has been tested.
Separate geometry error from speed error
A forecast can be wrong even when its inferred speed is correct. If a modeled front intersects Earth at a different part of an expanding shape than assumed, its remaining distance changes. In the twenty-million-kilometer toy example, an error of one million kilometers in that distance adds one thousand seconds at the assumed speed, or about 16.7 minutes. This is independent of the earlier speed calculation; the two errors might reinforce or partly cancel.
That possibility suggests a useful validation plot. For each eruption, show the range of arrival times obtained by varying plausible front shapes separately from the range obtained by varying speed. Then evaluate the combined prediction against the measured arrival. A very small final residual can result from two errors canceling, so it should not automatically validate both ingredients. Repeated tests across different viewing geometries would reveal whether polarization information reduces a persistent directional bias or mainly improves particular favorable events.
What would demonstrate a forecasting capability?
The next persuasive test would freeze an algorithm and evaluate a defined sequence of events, including missed eruptions, glancing encounters, overlapping fronts, and quiet periods. Researchers could publish the input data timestamps, processing delays, predicted arrival distributions, and a rule for declaring that an estimate has stabilized. A comparison must use the same warning time and the same definition of arrival for both the new method and its baseline. Otherwise, a better final error might partly reflect later information rather than a better model.
For example, ten correct alerts and ten false alarms tell a different operational story from ten correct alerts and no false alarms, even when the ten arrivals have identical timing errors. Calibration also matters: a claimed eighty-percent interval should contain the eventual arrival in approximately eighty percent of comparable cases. My reading of the 2026 proof of concept is that continuous imaging supplies a promising physical constraint on propagation. The responsible next claim is a testable program for measuring its reliability, while keeping the impressive May 2025 event visible as a specific result rather than a universal guarantee.
Sources & further reading
Primary papers, project documentation, and research releases used in this article. Publication dates below refer to the sources themselves.
- NASA’s PUNCH Sharpens Solar Storm Forecasting in First TestNASAPublished Checked
- Polarimeter to Unify the Corona and Heliosphere (PUNCH)PUNCH collaboration / arXivPublished Checked
- NASA’s PUNCH Begins Mission to Study Solar WindNASAPublished Checked
- NASA’s PUNCH Mission to Revolutionize Our View of Solar WindNASAPublished Checked
- Coronal Mass EjectionsNOAA / NWS Space Weather Prediction CenterChecked
FOLLOW THE QUESTION
Explore physics