PHYSICS
DESI’s 2026 Hydrogen-Forest Result Changes the Dark-Energy Conversation
DESI’s July 2026 hydrogen analysis sharpens a cosmic geometry test. Understand why its shift toward a cosmological constant matters without declaring the debate settled.
Research checked
Newest cited publication
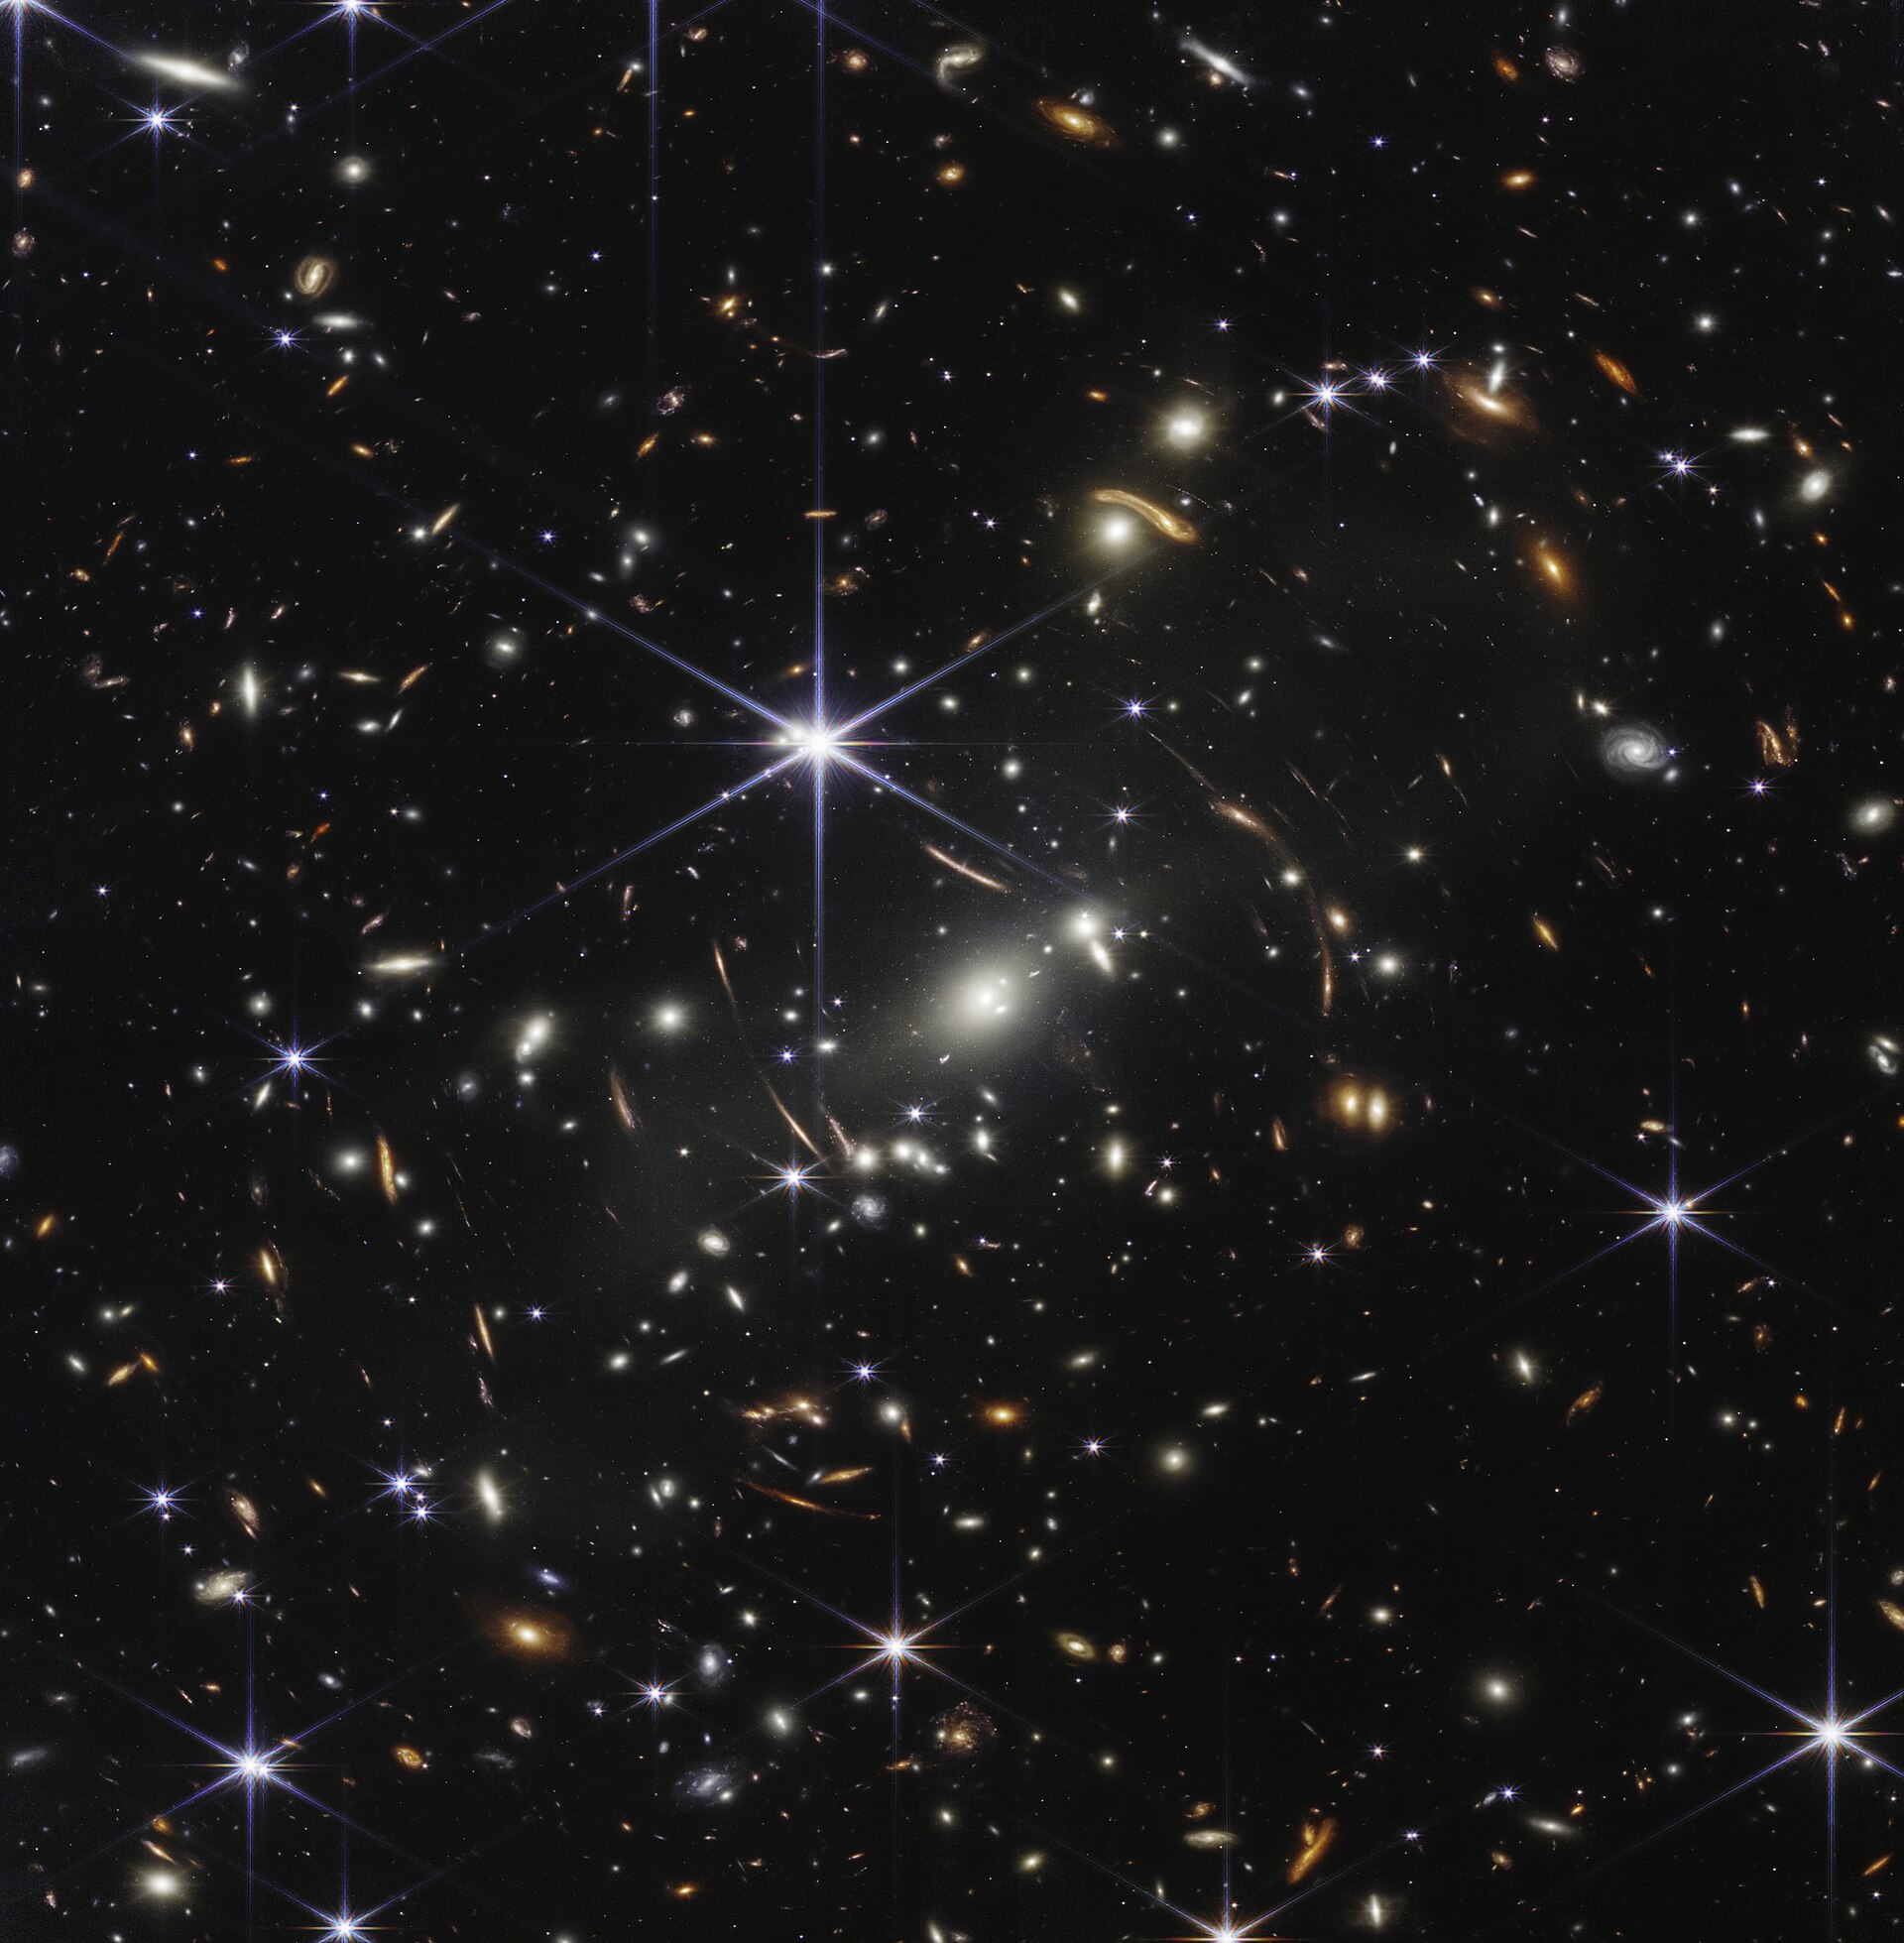
A Webb deep-field image provides distant-universe context; DESI’s hydrogen-forest analysis instead uses the spectroscopic measurements described in the article.
NASA, ESA, CSA, and STScI · Image source · Public domain

A scientific hint becomes interesting when a new measurement has a real chance to disagree with it. That is why the Dark Energy Spectroscopic Instrument, or DESI, deserves attention beyond the familiar headline that dark energy might evolve. On July 30, 2026, the collaboration announced a new analysis of intergalactic hydrogen absorption. Its sharper geometric measurement moved toward the standard cosmological-constant prediction. The associated paper, first submitted on July 29, still found a preference for evolving dark energy in specified combined datasets. These statements are compatible: a particular measurement can become more standard-model-like while a joint fit remains unsettled. Understanding that distinction is more useful than choosing an optimistic or pessimistic headline.
A spectrum can map material we cannot photograph
Imagine placing a distant lamp behind a corridor containing many partly transparent screens. You would learn about the screens by studying the missing light. The astronomical version uses a quasar as the lamp and intervening hydrogen as the absorber. Each absorbing region leaves its imprint at a wavelength stretched by cosmic expansion. The collection is called the Lyman-alpha forest. Comparing absorption along many quasar directions turns separate one-dimensional spectra into a statistical description of a three-dimensional distribution.
This is not a photograph of every hydrogen cloud, and absorption is not simply a direct reading of total matter density. Temperature, ionization, gas motion, and the relationship between gas and underlying matter affect the signal. The attraction is different: very distant regions that would be expensive to map galaxy by galaxy can still be sampled through absorption. DESI therefore gains a high-redshift geometric test using a tracer with a different observational chain from its nearby galaxy measurements.
Two directions make a geometry experiment
Baryon acoustic oscillations are a preferred statistical separation inherited from sound propagation in the early universe. For a simple geometric picture, imagine a population of circular markings drawn on a flexible surface. Their apparent dimensions depend on both the markings and your coordinate conversion. In cosmology, angular separations supply the transverse information, while differences in redshift supply the radial information. A wrong expansion model can stretch these directions differently. This directional inconsistency is the Alcock-Paczynski effect.
The July analysis uses more of the correlation function than the location of its acoustic feature. Its reported Alcock-Paczynski precision is about one percent at an effective redshift of 2.33, twice as tight as the acoustic-only constraint from the same data. The important conceptual gain is an additional geometric relationship, rather than an independent new cosmic ruler. Measurements derived from the same spectra share information. Treating them as unrelated votes would exaggerate what was learned.
A small coordinate error can resemble a physical anisotropy
Consider an illustrative pattern whose true characteristic size is 100 units in every direction. Suppose an analyst converts angles using a distance scale that is two percent too large but converts redshift differences using a scale one percent too small. The reconstructed pattern becomes 102 units across and 99 units deep. Its axis ratio is 102 divided by 99, approximately 1.0303. A three-percent shape distortion has appeared without changing the underlying pattern at all. These invented numbers explain the geometric logic; they are not DESI measurements.
Real surveys add an ambiguity absent from that example: velocities can create directional structure even with the correct geometry. Gas moving toward or away from the observer changes an observed redshift. Consequently, an anisotropic correlation cannot automatically be interpreted as an expansion measurement. The analysis must separate geometric stretching from velocity-related effects and observational processing. This is why obtaining a narrow error bar is only one part of the achievement. The interpretation depends on the model surviving deliberate attempts to break it.
Synthetic skies are instruments for detecting analysis bias
The supporting CoLoRe-2LPT work constructs simulated hydrogen-forest datasets using second-order Lagrangian perturbation theory, with more realistic clustering and contaminants than the previous approach. These are not alternative observations of our universe. They are controlled worlds in which an analyst knows the input and can ask whether the pipeline recovers it. A mock that looks visually convincing is insufficient: its relevant correlations, noise, and selection effects must be realistic enough to expose the failure being tested.
A useful analogy is checking a weighing scale with masses spanning its working range. One correct reading does not establish that the scale remains linear. Similarly, a cosmological fit can recover one mock while failing under a different gas prescription or contaminant population. More elaborate simulations are valuable when they widen the range of plausible failure modes. Agreement inside that range supports the analysis, while leaving an explicit boundary around what the validation has actually tested.
Excluding a biased parameter is part of the result
The validation paper reports a particularly informative limitation. Tests supported the acoustic and Alcock-Paczynski parameters, but mock studies revealed a significant bias in a growth-rate parameter, so that measurement was excluded from the final analysis. That choice separates a validated geometric inference from a growth inference the model could not yet support. It prevents the apparent abundance of outputs from becoming a false measure of scientific completeness. A pipeline can be adequate for one question and inadequate for another.
An engineering comparison helps. A sensor may measure average pressure accurately while responding incorrectly to rapid fluctuations. Certifying the average does not certify the fluctuation spectrum. In the same way, using a correlation function does not give every physical quantity encoded in it equal reliability. The omitted growth result is therefore useful information for readers. It identifies a concrete modeling problem that future work can address, rather than concealing uncertainty inside a broad claim that the whole analysis has been validated.
Different statistics can inform the same model
Another supporting paper links one-dimensional forest measurements to three-dimensional predictions. Its purpose is to use information along individual sightlines to inform assumptions about the larger correlation analysis. The physical intuition is straightforward: slicing a spatial field does not create unrelated physics. Certain gas properties influence both the variation along a line and the relationships between lines. Connecting those descriptions can constrain otherwise weakly known nuisance quantities, provided the connection is modeled and its uncertainty retained.
For an independent conceptual example, imagine estimating a fabric's texture from horizontal threads and from small rectangular patches. The two views emphasize different structures, but the material is shared. Combining them requires accounting for that shared structure; it does not justify multiplying the number of independent fabrics examined. Cosmological priors deserve the same care. A narrower posterior can reflect a more informative and justified model, yet readers should still ask which additional assumptions supplied the extra information.
Read the preference together with its conditions
The July paper reports a 2.7-standard-deviation preference for a two-parameter evolving-dark-energy model when combining DESI and cosmic microwave background data, rising to 3.2 with supernova data. Those are statements about named model and dataset combinations. They are not a probability that dark energy evolves, and they do not identify a microscopic mechanism. The collaboration's accompanying discussion emphasizes that the new hydrogen result itself shifts toward the cosmological-constant prediction. Both details belong in any account of the update.
My assessment is that the most productive next question concerns consistency across tracers, redshifts, and analysis choices. A physical explanation should connect measurements that were processed through substantially different observational pipelines. An apparent preference that changes sharply with a particular dataset or modeling choice demands further investigation. More data will help, but better agreement between geometry, gas modeling, and independent distance information matters equally. The 2026 update makes the dark-energy conversation more discriminating: it supplies a sharper test while preserving the possibility that the earlier hint will weaken.
Sources & further reading
Primary papers, project documentation, and research releases used in this article. Publication dates below refer to the sources themselves.
- New DESI DR2 Lyman-alpha Results Shed Light on Dark EnergyDESI CollaborationPublished Checked
- DESI DR2 Results IV: Alcock-Paczyński Measurements from the Lyman Alpha Forest and Cosmological ConstraintsDESI Collaboration / arXivPublished Checked
- Validation of the DESI DR2 Lyα forest full-shape analysisDESI Collaboration / arXivPublished Checked
- CoLoRe-2LPT: Lyman-α mock catalogues for the validation of DESI cosmological analysesDESI Collaboration / arXivPublished Checked
- Lyman-α forest holography: 3D predictions from 1D measurementsDESI researchers / arXivPublished Checked
FOLLOW THE QUESTION
Explore physics