ENGINEERING
Enhanced geothermal drilling reaches the reservoir reliability test
Cape Station’s 2026 commercial milestone and Utah FORGE’s extended circulation test reveal why drilling speed alone cannot establish reservoir reliability.
Research checked
Newest cited publication
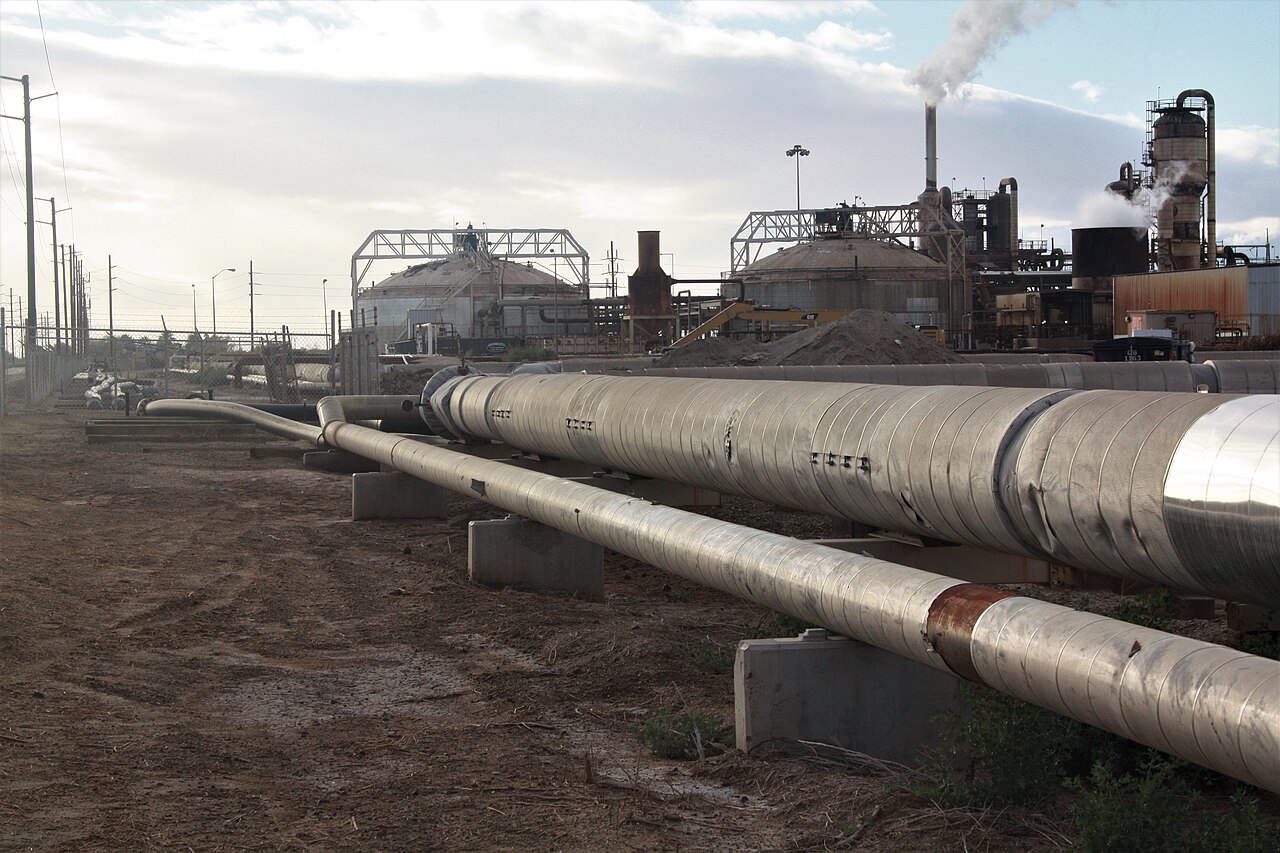
A geothermal plant near California’s Salton Sea illustrates surface equipment. The enhanced-reservoir behavior and drilling reliability discussed here require subsurface evidence.
Jack Catalano / Wikimedia Commons · Image source · CC BY 4.0

A geothermal well can be drilled quickly and still make a disappointing power station. The drill creates access to hot rock; the reservoir must subsequently return useful heat, manageable pressure and recoverable water over years. In 2026, enhanced geothermal systems reached a particularly revealing point in that progression. Fervo announced commercial operation of Cape Station’s first generating block on October 1, reporting 33 megawatts of net output. Separately, Utah FORGE began an extended circulation experiment in August. One is a commercial operating milestone and the other a research campaign. Read together, they show why the next engineering argument concerns sustained performance as much as construction speed.
What the October milestone actually establishes
Fervo’s October 1 announcement says its first Cape Station GeoBlock declared commercial operation on September 30 after synchronizing with the grid on September 24. The company reported that the block reached the 33-megawatt net production threshold required under its power purchase agreement. Those are specific operating claims from the developer. They should not be expanded into a claim that the entire approximately 100-megawatt first phase, or the additional 400-megawatt second phase, was already operating. The same release described the other first-phase blocks as still being commissioned and the expansion as under construction.
An acceptance threshold is useful because it joins underground performance to the equipment above ground and the electricity meter. Hot fluid by itself does not satisfy a grid contract. Pumps, heat exchangers, generators and auxiliaries must operate together. Even so, a successful commissioning period has a different evidential meaning from a long operating history. Engineers will want the distribution of output across seasons, scheduled maintenance, unplanned outages and changing reservoir conditions. The central question becomes how consistently a plant reproduces its accepted performance, rather than whether one impressive moment can be repeated in a presentation.
A faster well needs the right denominator
The drilling advance remains significant. In its July 8, 2026 release, Fervo reported drilling Sawtooth 7 to a measured depth of 19,448 feet, including a 7,500-foot lateral, in 21 days. Measured depth follows the borehole path; it is not vertical depth below the surface. This distinction matters when comparing generations of deviated wells. A longer horizontal section may increase access to a reservoir while changing drilling time, completion complexity and the amount of equipment placed at risk. Comparisons should therefore identify both the geometry and the scope of work counted.
A practical evaluation would track total completed-well cost as well as days to drilling depth. A hypothetical crew that drills ten percent faster but requires expensive remedial work afterward has not necessarily improved project economics. Conversely, a longer lateral that takes the same number of days may be a genuine productivity improvement even without a lower calendar time. These are analytical examples, not reported Fervo cost figures. They illustrate why learning curves need denominators such as productive lateral length, expected heat delivery and accepted well life before they can support a reliable forecast.
Turning flow into useful energy
The simplest reservoir heat balance is mass flow multiplied by the fluid’s heat capacity and its temperature drop through the surface plant. For an illustrative liquid-water calculation, a flow of 50 kilograms per second cooled by 80 degrees Celsius carries roughly 16.8 megawatts of thermal power if heat capacity is approximated as 4.2 kilojoules per kilogram per degree. That is heat, not electrical output. The conversion plant rejects substantial energy, while circulation pumps and other equipment consume electricity. The example is a rough engineering exercise; it does not describe a measured Cape Station operating point.
Increasing flow can raise extracted heat, but the required pressure difference can also increase. Pumping power is approximately pressure difference multiplied by volumetric flow and divided by pump efficiency. A reservoir that accepts more water only at rapidly rising pressure may offer less net benefit than its gross thermal output suggests. Fluid chemistry adds another layer: material can precipitate, corrode equipment or change hydraulic pathways. Useful operating records therefore align temperature, pressure, flow, chemical sampling and auxiliary electricity on the same timeline. A standalone high flow rate leaves most of that system balance unanswered.
Why months reveal what days can hide
The Department of Energy’s August 17, 2026 account describes Utah FORGE’s extended circulation test as a way to observe pressure, production stability, water recovery and heat extraction over months. It distinguishes this effort from the site’s 30-day test in August 2024. The later campaign had begun; its final long-duration outcome was not established by the launch announcement. That distinction prevents a proposed measurement program from being mistaken for a completed proof of reservoir lifetime. It also makes the experiment more useful: its purpose is to expose uncertainties that short tests cannot resolve.
Early temperature stability can be misleading if water initially encounters a favorable region that represents only part of the accessible rock. A short hydraulic pathway may supply strong initial flow while cooling more quickly than a broader network. A long test helps separate startup transients from slower changes, although extrapolation to decades still requires a model. An effective model should explain the measured pressure and temperature together and remain credible when later observations are withheld during calibration. Matching yesterday’s data is easier than forecasting the next operating interval without quietly changing assumptions.
Monitoring belongs inside the operating system
Reservoir reliability also involves how operators respond to induced seismicity. In its June 29, 2026 report covering November 2025 through April 2026, Fervo described 36 yellow-category events under its traffic-light procedure and no red-category events. It reported operational pauses after qualifying events. These statements concern a defined monitoring interval and an operator’s classification system; they are not a guarantee that larger future events are impossible. They nevertheless show that development includes measurement and intervention, rather than a simple instruction to inject at maximum achievable rate.
An engineering review would connect seismic observations to injection histories, local geology, sensor coverage and decision latency. Small events may reveal where the reservoir is responding, but measurement sensitivity and location uncertainty shape that interpretation. A trigger rule must also lead to an executable action: reducing injection, pausing a stage or checking instrumentation. Clear records allow an independent reviewer to reconstruct why an operating decision was made. Treating those records as part of the plant’s reliability evidence gives communities and engineers a more meaningful basis for judgment than a single cumulative injected-volume statistic.
What would make the next plant easier to trust
Repeatability will be strongest when later developments inherit a tested process while retaining site-specific geological investigation. Standardized surface equipment can simplify procurement, training and maintenance, but rock is not a factory component with identical properties in every delivery. A credible expansion plan should state which assumptions come from measured operation, which come from calibrated models and which remain contingencies. It should also show how underperforming wells could be isolated or replaced without turning an otherwise useful field into an extended outage.
The 2026 milestones support a more concrete geothermal discussion because they generate operating obligations and longer experiments. They do not erase the need to measure thermal decline, pumping requirements, water balances and intervention costs. The most valuable future update may therefore be an ordinary-looking record of stable net output and manageable maintenance. Such data would demonstrate that drilling progress survives the transition into reservoir operation. Until that history accumulates, commercial acceptance, experimental circulation and projected expansion should remain clearly labeled stages of the engineering case.
Sources & further reading
Primary papers, project documentation, and research releases used in this article. Publication dates below refer to the sources themselves.
- Fervo Energy Declares Commercial Operation at Cape Station Ahead of Schedule, Leading the Race for Next-Generation Geothermal EnergyFervo EnergyPublished Checked
- Fervo Energy Learning Curve Continues on 3rd Generation Well Design, Boosting Drilling Rates by 143% Since Its First Cape Station WellFervo EnergyPublished Checked
- Running Hot, Keeping Cool: FORGE Embarks on Extended Circulation TestU.S. Department of EnergyPublished Checked
- April 2026 Insights on Seismic Behavior at Cape StationFervo EnergyPublished Checked
FOLLOW THE QUESTION
Explore engineering