ARTIFICIAL INTELLIGENCE
AlphaEarth and a Map That Is Not a Photograph
AlphaEarth turns Earth observations into learned vectors. Its July 2026 custom-embedding preview makes the distinction between a map and a measurement especially useful.
Research checked
Newest cited publication
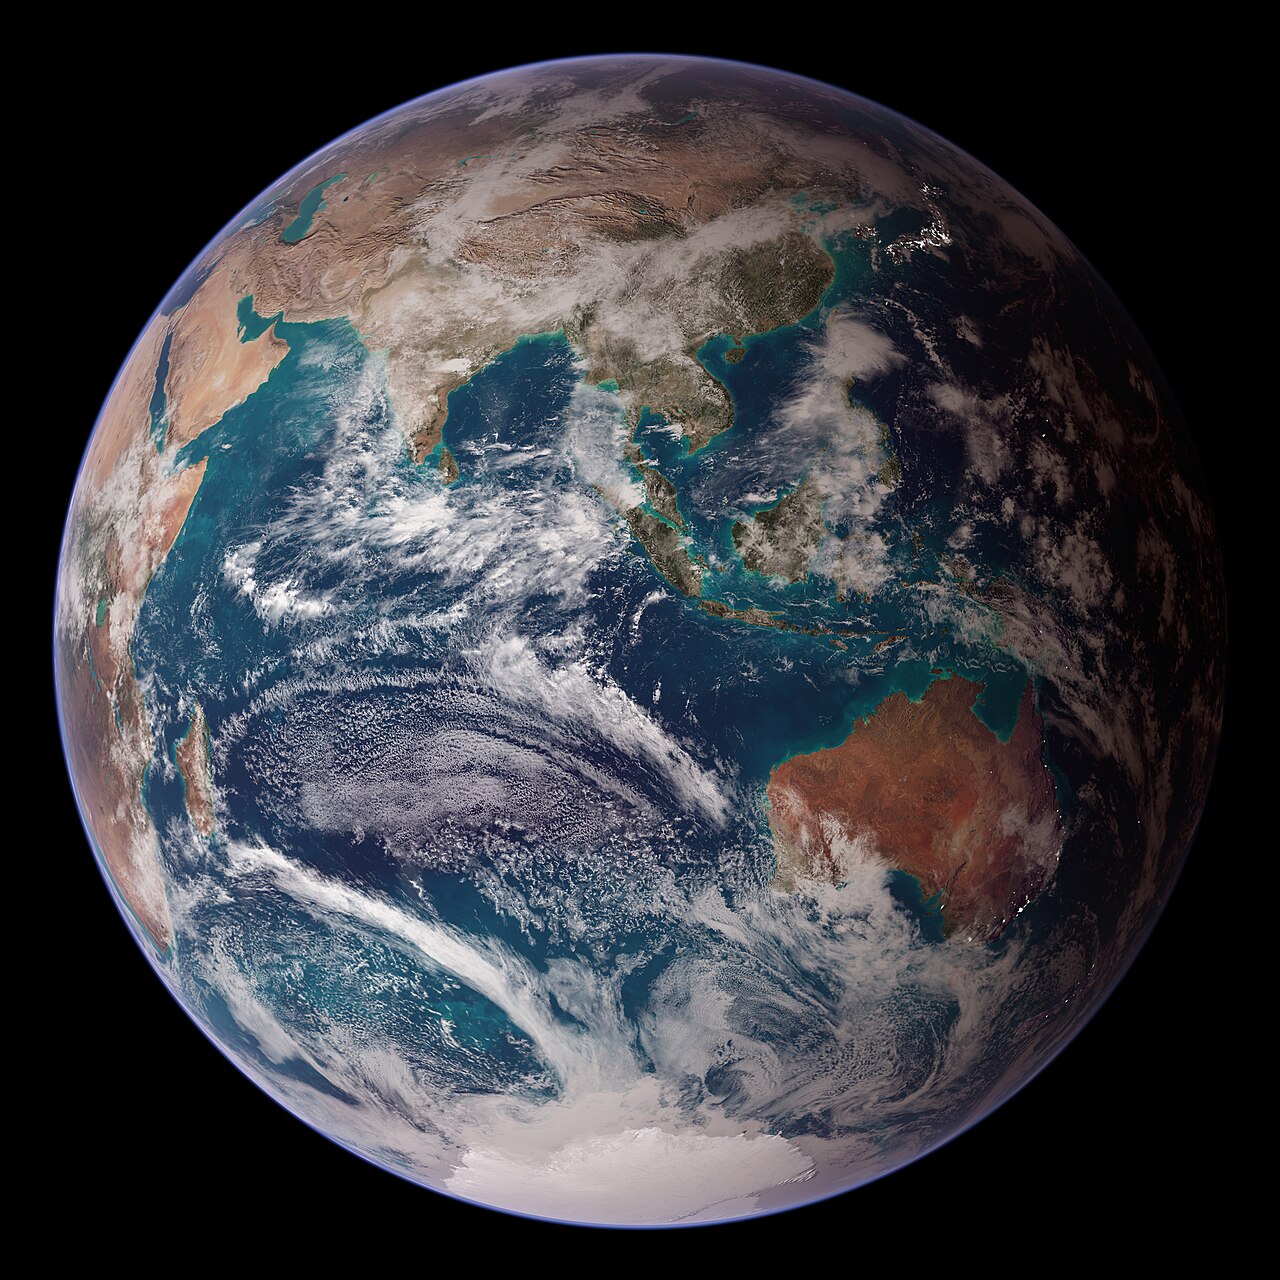
NASA’s Blue Marble composite illustrates the construction of an Earth representation from observations and other data; AlphaEarth produces a different learned representation.
Reto Stöckli, NASA; data from NASA and NOAA · Image source · Public domain

A brightly colored map can look like a photograph even when none of its colors mean red soil, green vegetation, or blue water. AlphaEarth Foundations produces that kind of map: a learned representation of Earth observations whose values are useful to a computer before they are intuitive to a person. Google introduced the system in July 2025. On July 29, 2026, Google Maps Platform announced a private preview of Custom Satellite Embeddings for selected places and time intervals. The update brings a timely question into focus. What changes when a representation designed for annual mapping begins to support more frequent monitoring, and how should users interpret what it appears to show?
Sixty-four coordinates are not sixty-four physical meters
The original AlphaEarth research describes an embedding field: a spatial representation that combines information across sources, times, and measurement contexts. The 2025 paper is available as an arXiv preprint, with a September revision. Its central evaluation question is whether reusable features support mapping with sparse labels without retraining the foundation model for every new task. That is a different objective from producing the sharpest satellite image or assigning a universal land-cover label to every pixel.
A useful analogy is a filing system organized by many hidden similarities. Two locations can be close in representation because several patterns resemble each other, even if an observer cannot give the relevant axis a simple name. A downstream classifier then learns which distinctions matter for a particular application. This separation lets the same representation support different tasks, but it also means a colorful rendering is not itself an explanation. The selection of three coordinates to display as red, green, and blue makes a visual summary; it does not convert those coordinates into directly observed physical quantities.
The geometry of similarity needs careful reading
Earth Engine's Satellite Embedding catalogue describes 64-dimensional unit-length vectors at 10-meter pixels. The representation is consistent across years, permitting comparisons through a dot product or angle. It also notes that the published dataset uses model version 2.1, whereas the research paper evaluates version 2.0. Model and dataset version fields therefore belong in an analysis record. Assuming the paper and every current tile are numerically identical would obscure a real distinction.
Here is an independent geometric illustration using two dimensions. Vectors (1, 0) and (0.6, 0.8) both have length one because 0.6 squared plus 0.8 squared equals one. Their dot product is 0.6. That number describes alignment, not a 40 percent loss of vegetation or a 60 percent probability of the same crop. In a learned 64-dimensional representation, the same warning applies more strongly. A similarity change can flag a location for investigation, but translating that change into an ecological category requires labels, validation, and knowledge of the application.
An annual summary carries a temporal assumption
The July 2025 launch release explains that AlphaEarth combines different Earth-observation data streams into annual representations. It reports an average error reduction of 24 percent relative to the tested comparison models across its evaluation set. That is a comparative research summary, not a promised reduction for every new mapping project. Different sensors can contribute complementary information, particularly where any individual stream is incomplete.
Time aggregation is useful but consequential. Imagine a field that is bare early in the year, densely vegetated in summer, and harvested later. An annual representation may use the sequence of observations to recognize the field's broader character. It cannot be interpreted as a direct measurement of the field on one arbitrary afternoon. For a task such as distinguishing stable land use, that summary can be an advantage. For a task such as locating a flood that lasted three days, the same temporal scale may be poorly matched. The important design choice is the relationship between the observation interval and the event being studied.
The 2026 preview changes the time window
The July 29, 2026 announcement presents Custom Satellite Embeddings as a private preview, complementing the existing annual dataset. It describes on-demand summaries for chosen regions and intervals, with frequencies down to five days depending on input sources. The announcement includes agricultural and fire-related examples. As of this article's cutoff, the cited announcement does not establish unrestricted public availability of the custom product, nor does it turn every potential monitoring use into an independently validated deployment.
The new flexibility raises an experimental question: what constitutes a meaningful difference between two windows? Comparing a growing-season month with a dormant-season month may reveal expected seasonal change rather than damage. Comparing two windows with different observation coverage can introduce another source of variation. A careful monitoring study would specify the interval, expected seasonal pattern, comparison region, and minimum evidence for declaring a change. My inference is that shorter windows make temporal controls more important, because the investigator has more freedom to select a period that makes a desired pattern appear convincing.
The file format can change the scientific answer
Google's Cloud Storage documentation gives unusually practical details. The files store signed 8-bit values that require a defined dequantization mapping before analysis; a reserved value represents missing data. It also specifies that coarser summaries should be constructed from decoded vectors and normalized, rather than by averaging the stored integers. The dataset is openly licensed under Creative Commons Attribution 4.0, with required attribution. Licensing permits reuse under its terms; it does not guarantee suitability for any particular scientific claim.
This is a case where engineering details are part of interpretation. If a nonlinear encoding is applied before storage, averaging the encoded numbers and then decoding generally differs from decoding first and averaging. For an elementary example, averaging the squares of two positive numbers is not generally the square of their average. The operations do not commute. A map could remain visually smooth after an incorrect processing step, so inspection alone may miss the problem. A reproducible pipeline should preserve the decoding rule, missing-data handling, coordinate system, aggregation procedure, and exact source version.
The most useful map includes a way to be wrong
An embedding map becomes an application only after someone defines the target. Forest type, building expansion, crop identity, and event damage are different questions. A classifier can perform well on one while being uninformative on another. The research framing of sparse-label mapping makes this distinction explicit: the representation helps use labels efficiently, but it does not remove the need to know what the labels mean.
A persuasive local evaluation would collect independent reference observations, separate neighboring or closely related examples across training and testing with care, and report errors by class and region. It would investigate whether a change signal survives reasonable alternative time windows. It would also show false alarms, missed changes, and uncertain boundaries rather than only successful examples. Those practices turn a striking picture into a measurable instrument. AlphaEarth's current direction is promising because it makes complex observations easier to reuse. The crucial intellectual move is to keep the learned vector, the displayed color, the downstream label, and the actual physical condition distinct enough that evidence can connect them.
Boundary errors deserve particular attention. A ten-meter pixel near a riverbank can contain a mixture of land and water, and its task label may depend on how a human defines the boundary. Treating every disagreement as a failure of representation would conceal that ambiguity. A good reference dataset should therefore record uncertain or mixed cases where feasible. Evaluating stable interiors separately from boundaries can reveal whether an apparently weak result comes from the model, the labeling convention, or a mismatch between their spatial scales.
Sources & further reading
Primary papers, project documentation, and research releases used in this article. Publication dates below refer to the sources themselves.
- AlphaEarth Foundations: An embedding field model for accurate and efficient global mapping from sparse label dataarXivPublished Checked
- AlphaEarth Foundations helps map our planet in unprecedented detailGoogle DeepMindPublished Checked
- Satellite Embedding V1Google Earth EngineChecked
- AlphaEarth Foundations GCS dataGoogle Earth EngineChecked
- Introducing Custom Satellite Embeddings, powered by AlphaEarth FoundationsGoogle Maps PlatformPublished Checked
FOLLOW THE QUESTION
Study engineering foundations