ARTIFICIAL INTELLIGENCE
Circuit tracing and the limits of a model map
Cross-layer transcoders turn model activity into inspectable graphs. New 2026 tooling makes those maps easier to build, while their causal limits still matter.
Research checked
Newest cited publication
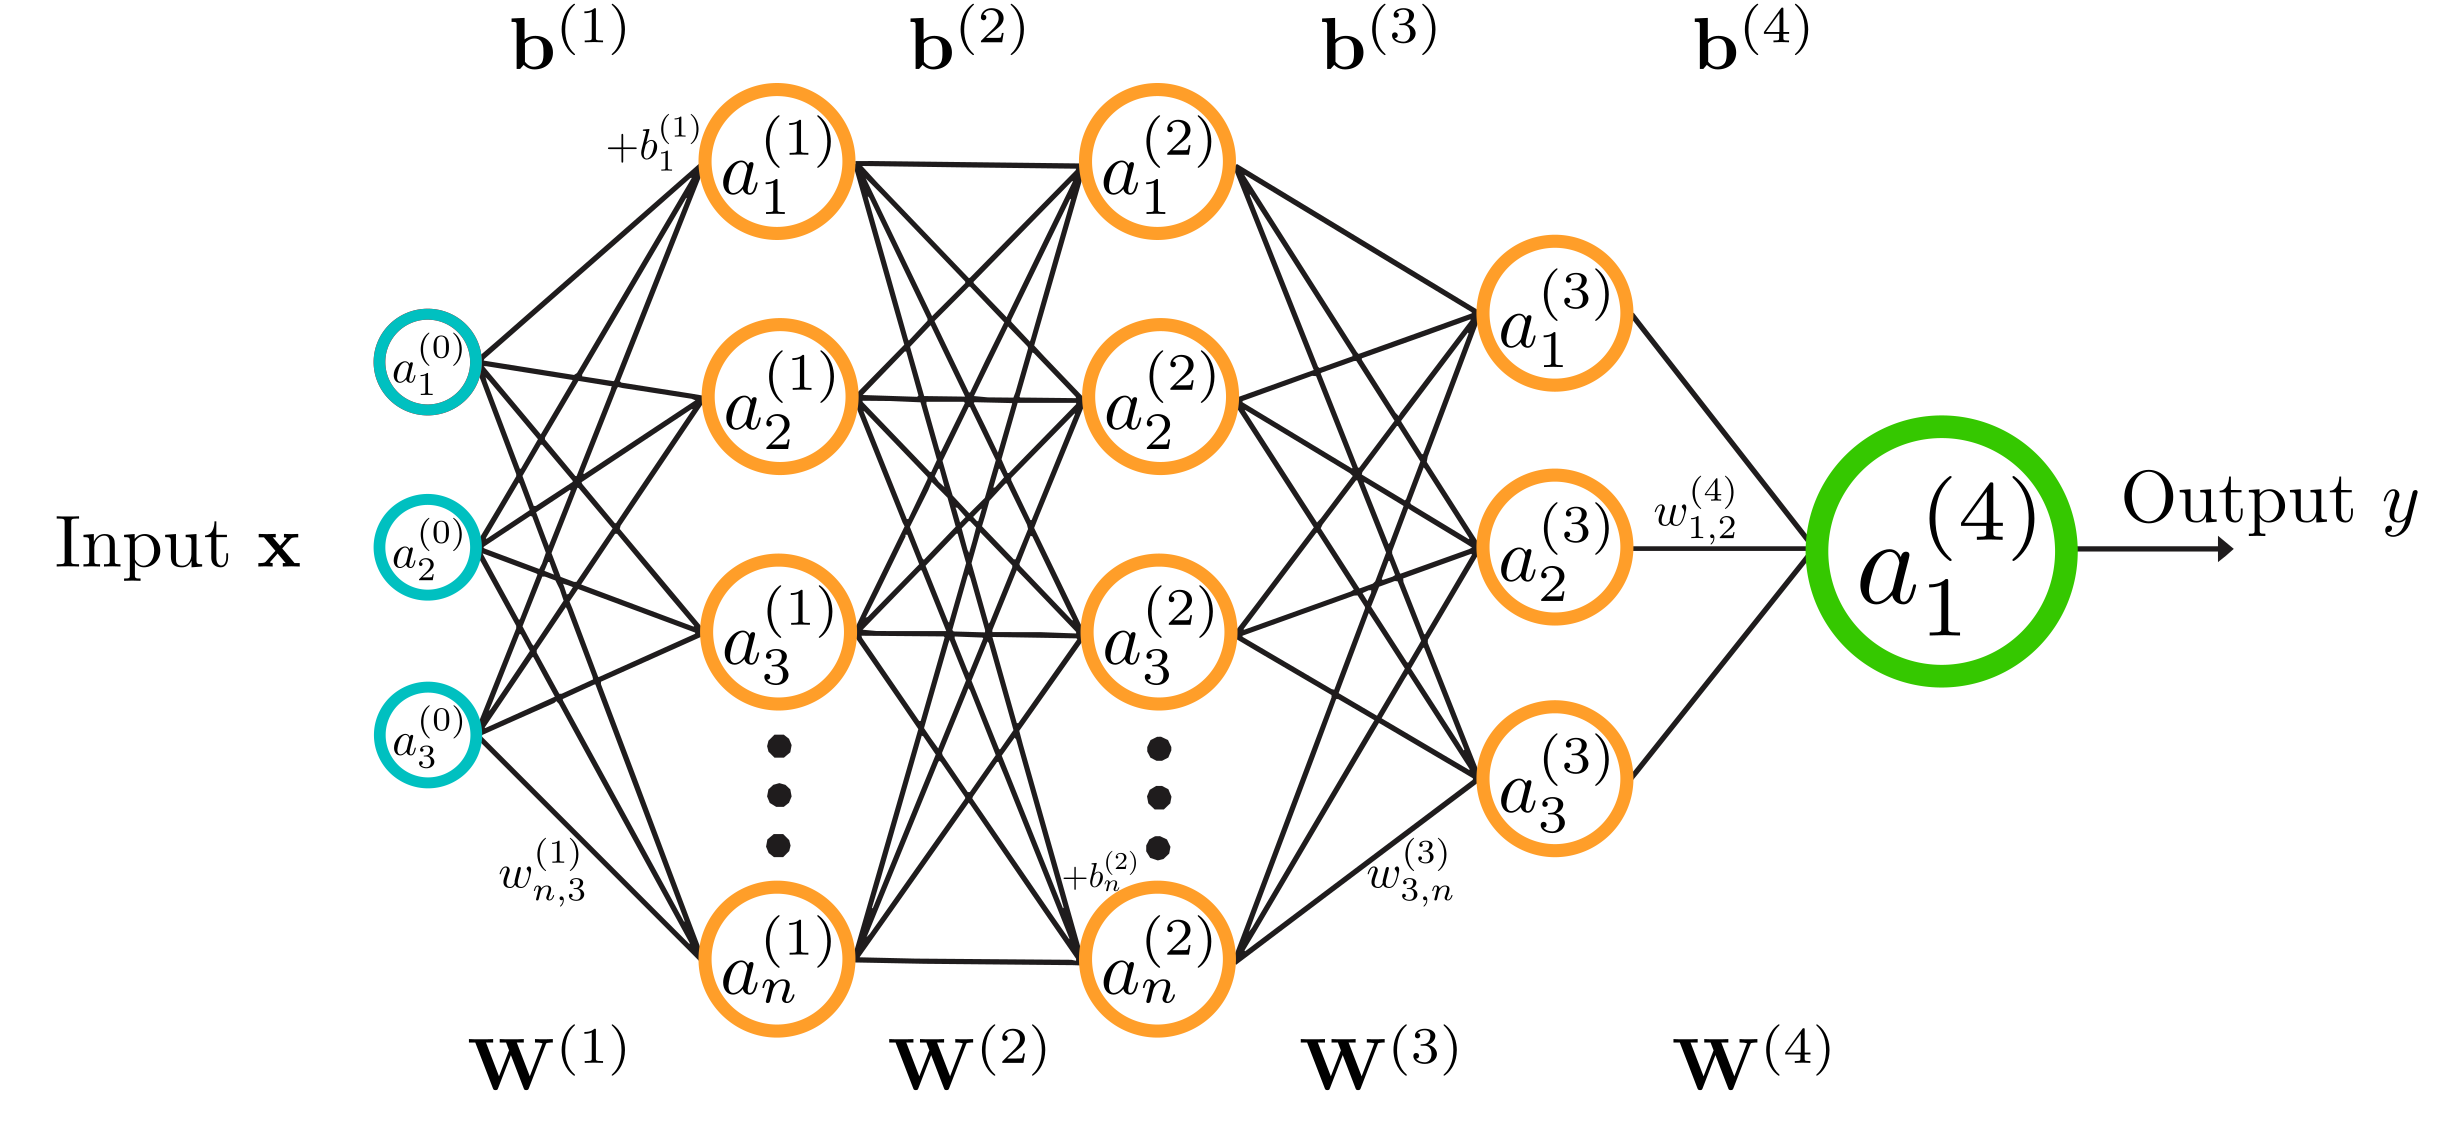
A network schematic illustrates connections between computational units; the circuit-tracing results discussed here use their own learned feature representations.
QuantuMechaniX8 · Image source · CC0 1.0

A colorful network diagram can make a language model appear suddenly understandable. An arrow connects a phrase in a question to a concept, another arrow connects that concept to an answer, and the mystery seems solved. Circuit tracing makes something more useful and more limited possible: a testable account of selected computations on a particular input. The central question is whether the diagram survives interventions in the original model. As of October 18, 2026, the field has moved beyond isolated demonstrations toward reusable infrastructure. The July 2026 revision of CLT-Forge is one example. Understanding that progress requires keeping three objects separate: the original network, the interpretable approximation, and the explanation a researcher constructs from the approximation.
Replace computation before drawing it
Anthropic’s March 27, 2025 methods paper introduced a circuit-tracing workflow based on cross-layer transcoders. A transcoder learns to approximate a network component using sparsely active features. Instead of explaining every neuron separately, the researcher works with a larger dictionary in which relatively few features activate on an input. Cross-layer decoding lets a feature contribute to approximations of later layers, reducing the need to rediscover an apparently persistent signal at every stage. This is an engineered coordinate system for studying a trained model, rather than a vocabulary supplied by the model itself.
A simple engineering analogy helps distinguish the tasks. Suppose an expensive simulator predicts a bridge’s displacement, and a smaller surrogate predicts almost the same displacement. Matching the final number is useful, but it does not show that the surrogate distributes forces through the same members. Likewise, accurate reconstruction is a necessary check on a model replacement, while a mechanistic interpretation needs additional evidence. A feature label such as a city name or grammatical relationship is initially a hypothesis about when that coordinate matters. Its human readability cannot establish that the replacement preserves the original causal route.
A graph explains an input, not a whole model
An attribution graph collects selected feature activations and their influences for a particular prompt and output target. The original circuit-tracing procedure also uses a local replacement construction that holds some quantities fixed. A graph can therefore expose a useful route through a computation without describing every alternative route the network could take on another input. Pruning removes weaker contributions so that a human can inspect the picture. The resulting clarity is purchased with omissions, which should remain visible in the interpretation.
The companion March 2025 study applied the method to Claude 3.5 Haiku and investigated behaviors including multilingual processing, arithmetic, and planning in poems. Those case studies show how an intermediate hypothesis can be confronted with targeted changes. They do not imply that every answer uses a comparably clean circuit. Consider an invented test asking for a country’s capital in two languages. Similar-looking internal coordinates are evidence of shared representation only after controls rule out shared spelling, tokenization, and answer-frequency effects. A compelling graph is the beginning of that experiment.
Interventions carry the causal burden
The strongest practical question is counterfactual: if this proposed intermediate signal changes, does the original model’s output change as predicted? One can suppress a feature, insert an activation from another example, or alter the input while preserving its meaning. Agreement across these tests is more informative than an attractive layout. Each test also has a failure mode. Removing an activation may produce a state the original model never encounters. Large steering values can disrupt many downstream processes, and redundant routes can hide the effect of removing one apparently important route.
An independent evaluation should therefore vary intervention size and compare against matched controls. If changing a candidate arithmetic feature alters answers, changing unrelated features with similar activation magnitudes should have a smaller or different effect. If both interventions destroy performance equally, the result supports fragility more than a specific arithmetic mechanism. This is a methodological inference, not a claim that existing studies exhaust those controls. The goal is to explain a narrowly specified behavior well enough that the next counterexample is informative.
Attention adds a routing question
A July 31, 2025 follow-up addressed an important gap in the original graphs: why attention routes information between particular positions. Its query-key attribution method decomposes attention scores into interactions between features at the querying and attended positions. That distinction matters because knowing what information crossed a connection does not automatically explain why that connection was selected. The study examined cases including induction and multiple-choice answering, adding a more explicit account of routing to the feature-level picture.
Imagine a document containing several dates and a question about a deadline. A useful explanation must distinguish representing dates from selecting the date attached to the relevant event. Otherwise, a graph may identify the right answer token while missing the selection rule that fails on a distractor. Adding a second date with the same format creates a sharp test. Routing analysis is valuable precisely because a model can store the necessary information and still retrieve the wrong part of its context. A map of content without a map of selection leaves that failure largely unexplained.
The 2026 advance is also infrastructure
CLT-Forge, revised July 21, 2026, packages training, activation caching, distributed computation, automated feature interpretation, attribution-graph construction, and visualization into a more unified workflow. Its contribution is practical accessibility: more groups can reproduce a pipeline and inspect the consequences of its settings. That is different from demonstrating a universal explanation of a frontier model. The work also makes resource choices explicit. Cached activations save repeated model computation, while compression introduces its own approximation and storage tradeoffs.
Those details belong in a scientific methods section. If two groups produce different explanations, the disagreement might arise from different language-model checkpoints, data samples, feature dictionaries, pruning thresholds, or cached numeric precision. A reusable pipeline makes these alternatives easier to isolate. For a careful replication, preserving configuration files and intermediate statistics is at least as important as sharing the final graph. Faster tooling improves the number of hypotheses that can be tested; it does not reduce the evidential standard for calling one of them a mechanism.
What a useful map should report
A responsible circuit-tracing report should identify the exact model, input distribution, replacement error, graph-pruning rules, intervention procedure, and behaviors that remain unexplained. It should also show failures. A circuit discovered on short factual questions may not transfer to long conversations, and a feature that works in one language may miss a different tokenization regime. These are boundaries of the explanation, not embarrassments to hide. Publishing them gives another group a concrete target for improvement.
The larger opportunity is a cumulative science of model behavior. A graph can suggest a reusable hypothesis, a second group can build a difficult counterexample, and improved instrumentation can explain the discrepancy. That cycle is more credible than treating any single visualization as a complete model map. Circuit tracing has made internal computation easier to interrogate. The next achievement is to show which explanations remain stable when the question, the dictionary, the intervention, and the model itself all change.
A particularly useful benchmark would publish a mechanism prediction before revealing a family of transformed prompts. Researchers could then score not only whether the model answers correctly, but whether the predicted internal dependencies survive. That separates explaining an already inspected example from anticipating a new one. Successful prediction would provide a stronger reason to trust the abstraction, while failed prediction would identify exactly where the map needs another computational component.
Sources & further reading
Primary papers, project documentation, and research releases used in this article. Publication dates below refer to the sources themselves.
- Circuit Tracing: Revealing Computational Graphs in Language ModelsAnthropic / Transformer CircuitsPublished Checked
- On the Biology of a Large Language ModelAnthropic / Transformer CircuitsPublished Checked
- Tracing Attention Computation Through Feature InteractionsAnthropic / Transformer CircuitsPublished Checked
- CLT-Forge: A Scalable Library for Cross-Layer Transcoders and Attribution GraphsarXivPublished Checked
FOLLOW THE QUESTION
Study engineering foundations