PHYSICS
ADMX’s 1.1–1.3 GHz search: listening for axions without mistaking noise for matter
ADMX’s verified 2025 microwave search probes a fresh axion band while showing why frequency coverage, noise and halo assumptions shape every limit.
Research checked
Newest cited publication
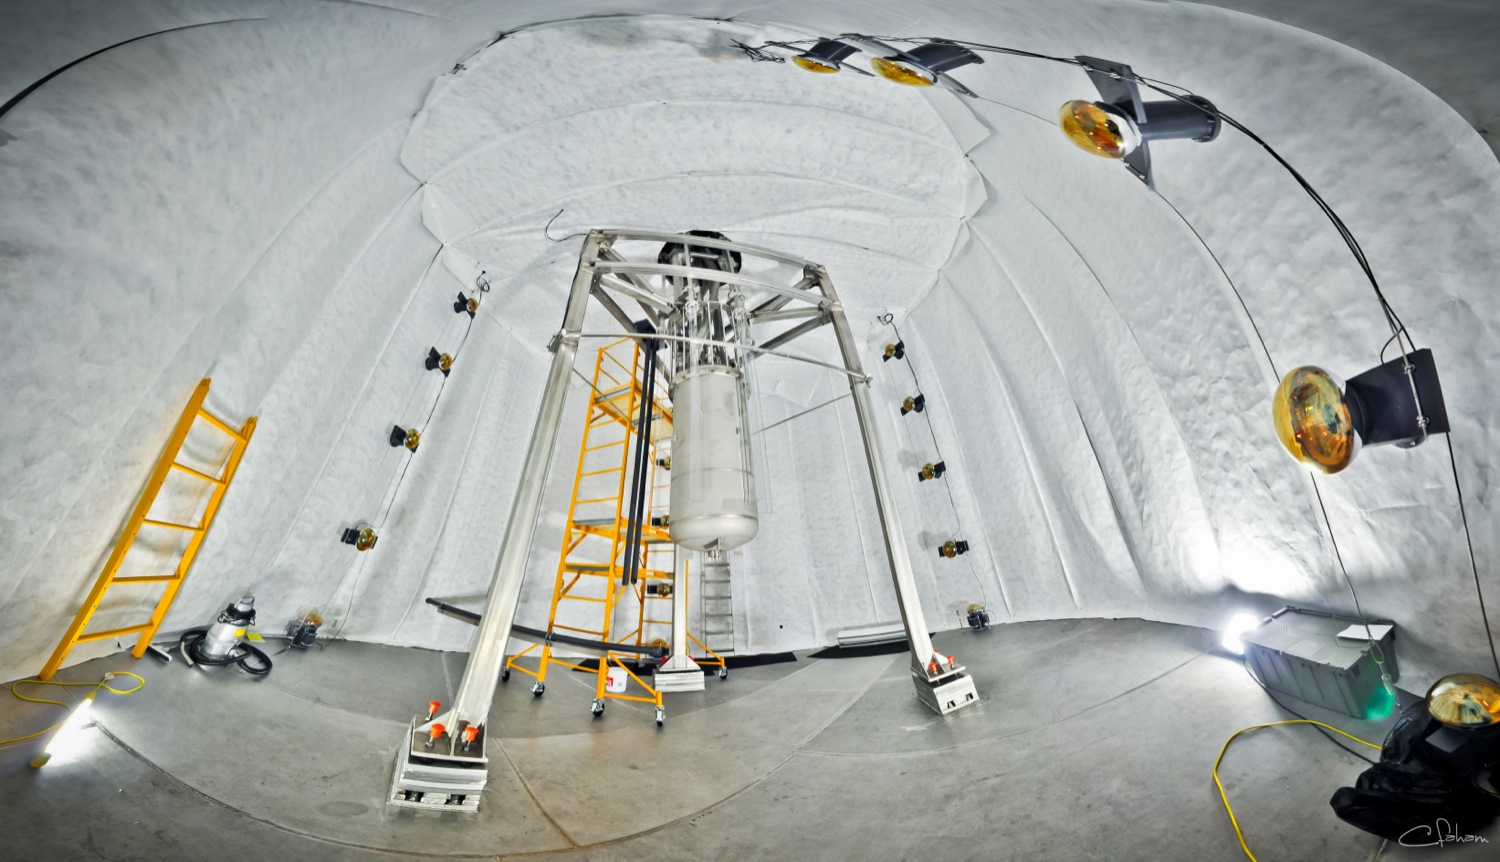
The LUX underground detector supplies rare-event-search context. ADMX uses a resonant microwave cavity rather than a xenon target.
Carlos Faham (Gigaparsec at English Wikipedia) · Image source · CC BY 3.0

Searching for dark matter can resemble tuning a radio whose station frequency has never been announced. The analogy becomes unusually literal in the Axion Dark Matter eXperiment, or ADMX, which looks for microwave power that hypothetical axions could produce inside a magnetic field. Its 2025 report on the 1.10–1.31 GHz band is the current verified result examined here. The paper first appeared on April 9 and was revised on October 3, 2025. No axion signal survived that analysis. Its value lies in the precise frequency band and coupling strengths it tested, together with the assumptions that define what remains beyond its reach.
A new frequency band is a new mass interval
The collaboration’s 2025 paper reports no surviving axion signal and presents 90% confidence limits reaching beyond the Kim–Shifman–Vainshtein–Zakharov benchmark coupling in the scanned band. That model is usually shortened to KSVZ. It did not achieve the weaker Dine–Fischler–Srednicki–Zhitnitsky, or DFSZ, benchmark sensitivity while maintaining the desired scan rate in this run. Distinguishing those benchmarks prevents the claim that reaching one theoretical target means excluding every conventional axion model.
Frequency matters because a nonrelativistic axion’s rest energy largely sets the converted photon’s energy. Using energy equals Planck’s constant times frequency, a 1.10 GHz photon has an energy of approximately 4.55 microelectronvolts; at 1.31 GHz it is approximately 5.42 microelectronvolts. These are calculated conversions, not separate mass measurements. A detected spectral feature would still require checks showing that it originated from the hypothesized particle rather than an electrical signal.
A resonator selects one small piece of the problem
The central idea is a haloscope: an instrument seeking axions in the Galactic dark-matter halo by converting them into photons in an applied magnetic field. A microwave cavity boosts sensitivity near a resonance. Cooling and a low-noise amplifier make the tiny added power easier to distinguish from fluctuations. The apparatus is therefore both a particle detector and a carefully characterized microwave measurement system.
A resonator gains sensitivity by concentrating its response into a narrow interval. That creates a tradeoff. Holding one tuning position longer can improve the estimate of power there, but the unknown particle mass may correspond to a different frequency. Scanning too quickly covers more possibilities with inadequate depth; scanning very slowly can leave most of the interesting range untouched. The correct performance summary is a map of sensitivity across frequency, together with gaps and assumptions, rather than the lowest noise figure achieved on a favorable day.
Why a narrow signal is expected
An independent order-of-magnitude calculation explains why a halo search expects a narrow line. For particles moving much slower than light, kinetic energy divided by rest energy is approximately one half of speed divided by light speed, squared. At a representative speed of 300 kilometres per second, the ratio is about five parts in ten million. Around a gigahertz, that corresponds to a frequency contribution of roughly five hundred hertz. A realistic distribution of velocities broadens the feature rather than placing every axion at one exact frequency.
That calculation is illustrative, not the ADMX likelihood model. The real line shape depends on the assumed velocity distribution and the detector’s motion. A narrowband analysis can gain power by combining bins in the shape expected for a signal, but the gain comes with a dependence on that shape. An unexpected stream of particles or a different speed distribution may require a different template. A search is always sensitive to a family of predicted signals, not to an abstract particle name alone.
A coupling limit also contains an astrophysical assumption
The 2025 result assumes a local dark-matter density of 0.45 GeV per cubic centimetre and a Maxwell–Boltzmann line-shape model when deriving its displayed coupling limits. Some frequency gaps arise where the desired cavity mode crosses other modes. A continuous-looking frequency axis should not be mistaken for uniform acceptance everywhere along it.
The basic scaling clarifies the density dependence without requiring a new simulation. For a fixed instrument, converted power is proportional to the axion density and to the square of its photon coupling. If the actual axion density were one quarter of the assumed value, the same measured power threshold would require twice the coupling. The calculation follows from holding density times coupling squared constant. Consequently, a limit made under the assumption that axions supply the halo should be rescaled before applying it to a model in which they provide only a fraction.
Cold hardware does not automatically mean a cold measurement
Thermal fluctuations can mask a small microwave signal, so lower temperatures are useful. Yet the temperature of one refrigerator stage is not necessarily the temperature relevant to every source of noise. Thermal contacts, amplifier noise, gain calibration and unwanted radio-frequency pickup all enter the measurement. An engineering improvement is valuable when it improves the calibrated signal-to-noise ratio across a working scan, rather than merely producing a lower temperature at one sensor.
For a simple radiometer, holding other quantities fixed, the signal-to-noise ratio grows as the square root of integration time. That means doubling the ratio by waiting requires roughly four times as long. Reducing effective noise can therefore save substantial scan time. This elementary scaling is why noise engineering has direct scientific consequences: it changes the amount of mass range that can be searched at a meaningful coupling strength in a finite observing program.
A persistent tone must survive tests of its origin
In a generic cavity search, follow-up has to test a feature’s physical origin as well as its persistence. A researcher can ask whether the measured power follows the expected resonant response or instead behaves like interference introduced elsewhere in the receiver. A deliberately injected signal can test whether the search pipeline recovers a feature it should find. Those are examples of useful controls, not independent evidence that a candidate came from dark matter.
Imagine a tone that remains unchanged as the cavity is tuned away from it. The tone may be quite real electrically, yet the lack of the expected resonant response can undermine its origin inside the cavity. The checks become more convincing when they expose different vulnerabilities, because repeating the same receiver configuration can reproduce the same interference. These distinctions are especially important in extremely sensitive instruments, which can faithfully measure interference that ordinary electronics would barely notice.
A useful null result remains reproducible
A frequency-dependent exclusion is most useful when another group can reconstruct how the response changes across the scan. A narrow unsearched gap is still a gap; averaging it together with neighboring successful settings would conceal the place where a signal could have escaped. The same principle applies to temporary periods of poor calibration or an efficiency that varies with tuning.
This is an inference about transparent reporting rather than a new experimental result. Recording those details makes it possible to compare instruments without pretending that their best operating points characterize every observation. It also lets future analyses revisit a dataset under a different signal shape while preserving what the original measurement actually contained.
Other axion searches ask different questions
ADMX has also published a 2023 search for a broad cosmic axion background, using a daily-modulation strategy rather than the narrow spectral form expected from cold halo particles. The collaboration explicitly described that relativistic background as distinct from dark matter. Separately, Lawrence Livermore’s project documentation describes solar axion searches with helioscopes, which use the Sun as a possible source. These programs constrain different production stories and do not amount to repeated measurements of one identical target.
My assessment is that the most useful near-term advance would combine broader coverage with preserved calibration quality and deeper sensitivity. A headline claiming that the axion has been ruled out would be much too broad. The 2025 ADMX result instead makes a precise contribution: it tests a defined microwave band, reaches a stated benchmark under stated halo assumptions, and shows how candidate rejection protects the interpretation. The remaining space is a map for further experiments, not permission to describe an undetected particle as already found.
Sources & further reading
Primary papers, project documentation, and research releases used in this article. Publication dates below refer to the sources themselves.
- Search for Axion Dark Matter from 1.1 to 1.3 GHz with ADMXADMX Collaboration / arXivPublished Checked
- Axion Dark Matter eXperiment: Run 1B Analysis DetailsADMX Collaboration / arXivPublished Checked
- Search for a dark-matter induced Cosmic Axion Background with ADMXADMX Collaboration / arXivPublished Checked
- Particle astrophysicsLawrence Livermore National LaboratoryChecked
FOLLOW THE QUESTION
Explore physics