PHYSICS
What the Pulsar-Timing Background Can Tell Us About Growing Galaxies
New 2026 pulsar-timing analyses connect a slow gravitational-wave background to black-hole growth while exposing model degeneracies and detection limits.
Research checked
Newest cited publication
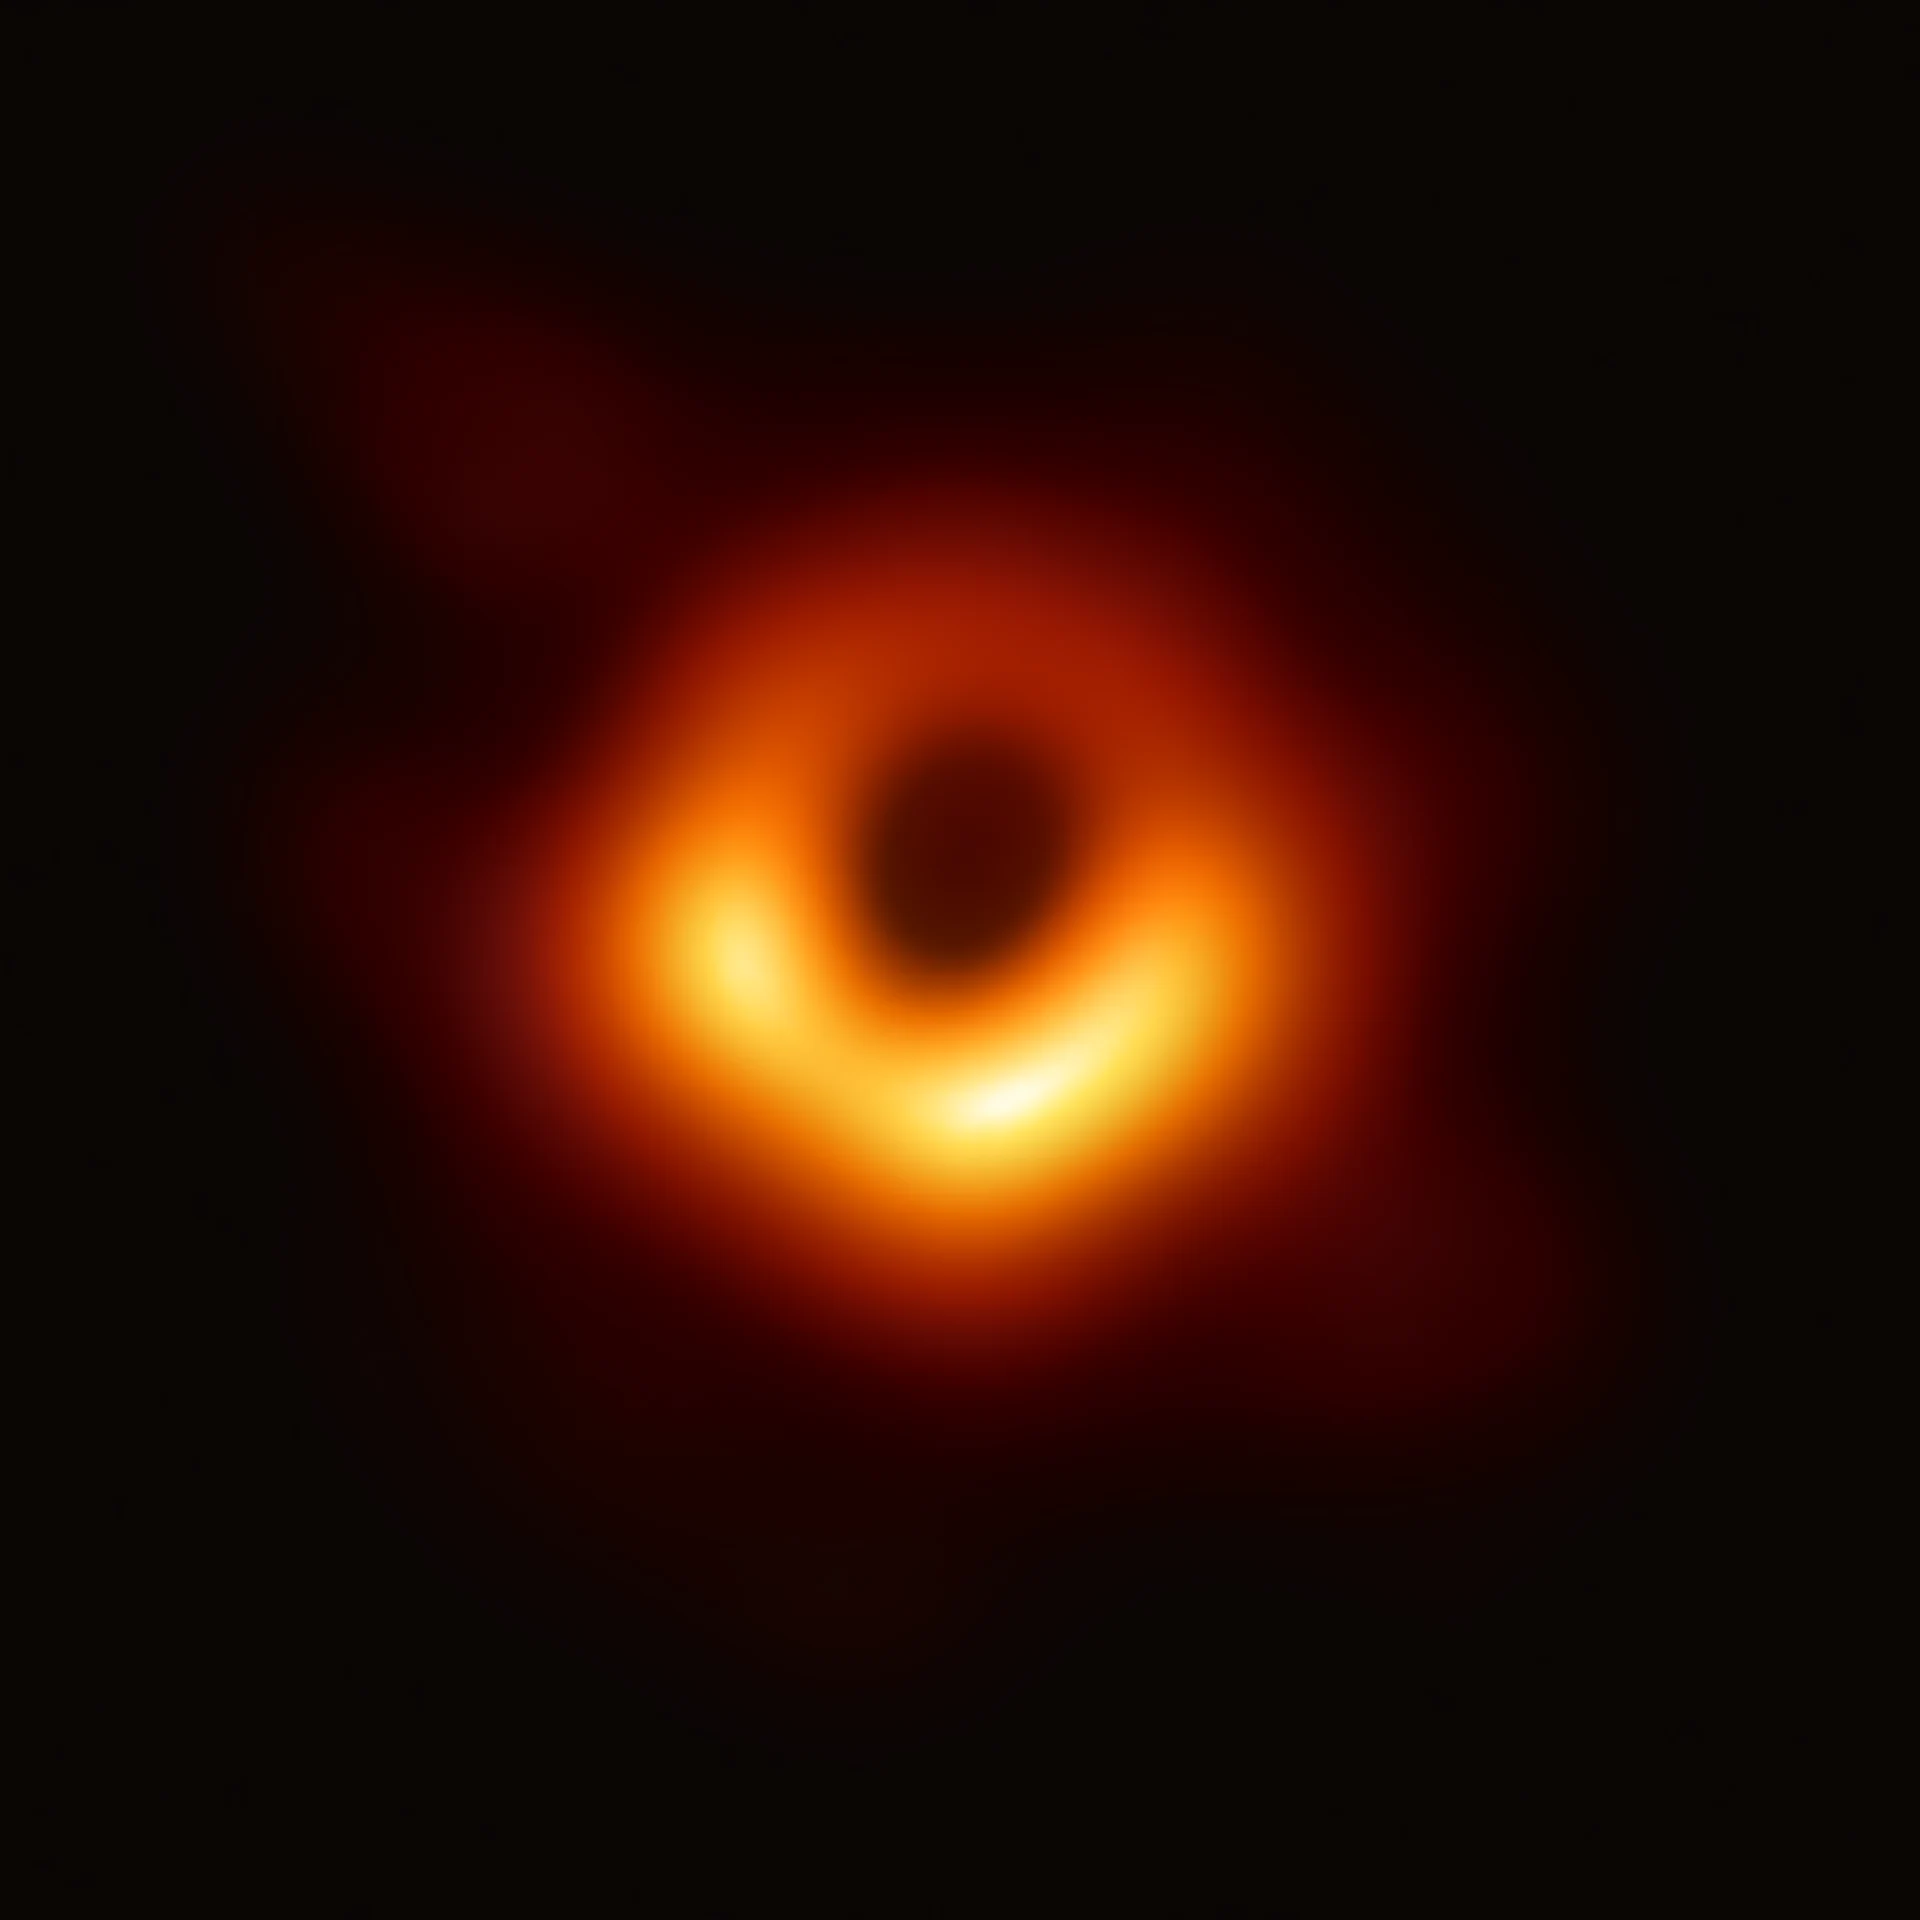
The M87 black-hole image provides context for massive black holes at galactic centers. Pulsar timing probes a population through a different observational method.
Event Horizon Telescope / ESO · Image source · CC BY 4.0

The slowest gravitational waves currently studied with pulsars take years to complete a cycle. They cannot be understood by imagining a scaled-up version of a brief LIGO chirp. Their evidence accumulates in the timing of many rotating neutron stars, and their interpretation depends on an entire population of sources. In 2026, this field advanced through work on black-hole–galaxy evolution, more cautious targeted searches, and an independent Indian Pulsar Timing Array analysis posted on August 3. These developments do not amount to a new photograph of a supermassive binary. They show how a faint statistical pattern can constrain the histories of galaxies, provided instrumental evidence and population interpretation remain clearly separated.
An array compares clocks, rather than hearing one chirp
A pulsar emits a repeating signal as its rotation sweeps radiation toward Earth. Astronomers build a timing model that predicts when pulses should arrive after accounting for rotation, orbital motion where relevant, the Earth's motion, and propagation through ionized material. The residual is the difference between observed and modeled arrival time. A gravitational wave can alter that arrival sequence. An array searches for a shared structure across the residuals of different pulsars, rather than trusting an unusual fluctuation in one star's timing.
The June 2023 NANOGrav analysis reported evidence for correlated timing behavior in its 15-year data set. That is the observational foundation for much subsequent interpretation, not a fresh 2026 observation. The separation of dates matters: a paper published in 2026 can extract a new population constraint from an older measurement without supplying another independent background detection. At a frequency of one cycle per year, the frequency is about 31.7 nanohertz. A 15-year baseline reaches characteristic frequencies of roughly 2.1 nanohertz. These simple inverse-time conversions explain why long duration is a physical resource in this experiment, not merely a way to average away more measurement noise.
The arrangement of pulsars helps identify the signal
A common low-frequency fluctuation does not uniquely identify gravitational waves. A clock error could affect observations together, while an error in the Solar System model can introduce another shared spatial pattern. The expected gravitational-wave background instead generates a particular relationship between timing correlation and the angular separation of pulsar pairs, known as the Hellings–Downs curve. Testing the pattern asks how the array behaves as a network, rather than only whether each pulsar contains extra red noise. Red noise means fluctuations weighted toward longer timescales.
A harmonic analysis first posted in November 2024 and listed among NANOGrav's 2025 publications let the angular pattern vary more flexibly. It found quadrupolar support but also showed how allowing lower-order components changed the evidence, including sensitivity to a feature near 4 nanohertz. This is a useful example of analysis maturity. A result should be challenged with models that can expose alternative spatial structure, rather than protected by a restricted fit. More pulsars, wider sky coverage, and better characterization of shared systematics help determine which part of a correlation is gravitational. A single significance label cannot replace that diagnosis, because the label depends on the competing models included in the comparison.
A background encodes many hidden systems
One plausible origin is the combined emission of supermassive black-hole binaries formed during galaxy assembly. Each system contributes at frequencies determined by its orbital motion and evolution. A background description summarizes the combined signal when individual contributors are not cleanly separated. It should not be confused with an equal contribution from every galaxy or with a direct count of binaries. Rare massive systems can have disproportionate influence, and a finite population can produce departures from an ideally smooth spectrum.
For an illustrative population consisting of circular binaries whose evolution is driven only by gravitational radiation, the characteristic strain follows a familiar frequency dependence proportional to frequency to the power minus two thirds. The assumptions do work here. Interactions with stars or gas can alter how long binaries remain at particular separations. Eccentricity redistributes radiation among harmonics. Different merger histories change the number of systems available. A measured spectrum is therefore a constrained mixture of source abundance, source mass, and residence time. Inferring a formation history requires modeling that mixture and asking which other observations could distinguish alternatives, rather than identifying a slope and declaring the origin settled.
The 2026 galaxy-growth result illustrates a real degeneracy
Cayenne Matt and collaborators studied how the relationship between black-hole mass and galaxy bulge mass affects predictions for the background. The work appeared as a preprint on August 25, 2025, and in The Astrophysical Journal in 2026. Their models could reproduce the observed amplitude either with more very massive galaxies or with a black-hole-to-bulge relation whose normalization increases toward earlier cosmic times. This is a model comparison using the background, not a direct measurement of every past galaxy's central black hole.
A simple toy expression helps explain why the alternatives can be difficult to separate. Suppose a measured population signal scales with a number density N multiplied by a strong mass-dependent factor. Increasing N and increasing typical mass can both raise the signal. The detailed gravitational-wave calculation is more complicated, but the inference problem has the same geometry: several parameter combinations map to a similar observable. Independent information about galaxy abundances, black-hole masses, and binary evolution can reduce that ambiguity. A valuable result can therefore be a well-defined family of allowed histories. It tells observers which additional census would be informative, even when the existing background does not select a unique evolutionary story.
An interesting galaxy is not yet a gravitational-wave source
The NANOGrav targeted-search paper provides a particularly important date-sensitive example. Its January 13, 2026 revision analyzes 114 active galactic nuclei with outside information such as sky position and candidate periods. In that revised analysis, the target set is consistent with noise; modest preferences in two cases do not survive the broader coherence and trials assessment as detections. Reading an initial abstract or an older search snippet can therefore produce a materially different impression from reading the current paper.
Targeting improves efficiency because information from electromagnetic astronomy narrows the gravitational-wave search. Yet a periodically varying quasar can have explanations besides a binary orbit, and a statistical fluctuation becomes less surprising when many targets are examined. If one performed a hundred independent tests with a one-percent false-positive probability each, the chance of at least one false positive would be about 63 percent. Real searches are not exactly this classroom setup, but the calculation explains the trials issue. A convincing individual binary needs consistency across the array and across reasonable noise models, along with electromagnetic evidence that has survived its own alternative explanations.
Why the August 2026 non-detection is informative
The Indian Pulsar Timing Array's August 3, 2026 preprint searches data from 27 pulsars over a maximum 7.2-year baseline. It does not report significant Hellings–Downs correlations. Under a specified fixed-spectrum model, its 95-percent amplitude upper limit is 3.4 times ten to the minus fourteen. The paper notes that this is above the amplitudes inferred by longer-running arrays. Consequently, the non-detection does not contradict those arrays merely because the word background appears in both analyses. The experiments currently probe different sensitivity regimes.
An upper limit becomes an exclusion only when it is below a model's predicted observable under compatible assumptions. If an instrument cannot detect a faint lamp, that failure says little about whether a brighter instrument saw the lamp. For pulsar arrays, the comparison must also align spectral conventions, noise models, observing duration, and frequency coverage. The path forward is to strengthen the shared angular pattern, resolve spectral structure, and eventually connect individual sources to host galaxies. The 2026 results show both the reach and the limits of that program: pulsar timing can test histories of black-hole growth today, while the causal story remains something to infer and challenge, rather than something already visible in a single signal.
Sources & further reading
Primary papers, project documentation, and research releases used in this article. Publication dates below refer to the sources themselves.
- The NANOGrav 15-year Data Set: Evidence for a Gravitational-Wave BackgroundarXiv; NANOGrav CollaborationPublished Checked
- The NANOGrav 15 yr Data Set: Harmonic Analysis of the Pulsar Angular CorrelationsarXiv; NANOGrav CollaborationPublished Checked
- Inferring Mbh-Mbulge Evolution from the Gravitational Wave BackgroundarXiv; Cayenne Matt and collaboratorsPublished Checked
- The NANOGrav 15 yr Data Set: Targeted Searches for Supermassive Black Hole BinariesarXiv; NANOGrav CollaborationPublished Checked
- The Indian Pulsar Timing Array Data Release 2: III. Search for a Stochastic Gravitational Wave BackgroundarXiv; Indian Pulsar Timing ArrayPublished Checked
FOLLOW THE QUESTION
Explore physics